Macro Signal strength #23
Global macro view of 30+ countries
This Content is intended for educational purposes only. No portion of this Content purports to be, individualized or specific investment advice and is not created to provide investment advice to individuals. All information provided is impersonal, general in nature and is made without regard to individual levels of sophistication or investment experience, investment preferences, objectives or risk parameters and without regard to the suitability of the Content for individuals or entities who may access it. No information found on this Newsletter, nor any Services provided, should be construed as an offer to sell, or a solicitation of an offer to buy any security or investment vehicle, nor should it be construed as tailored or specific to you, or any reader or consumer thereof. You understand and agree that this Content does not constitute specific recommendations of any particular investment, security, portfolio, transaction or strategy, nor does it recommend any specific course of action is suitable for any specific person or entity or group of persons or entities
The macro signal will examine the growth and inflation regime in the context of the market microstructure. That is, the data will not be monthly or quarterly, but daily and weekly. It is more of a high frequency approach given daily/weekly activity. By using machine learning and Bayesian inference, it is possible to get a pretty good signal out of large data sets.
What data goes into this regime classification? I try to put together a structure from all possible angles to account for the interactions between different variables. Every week the model gets retrained to keep up with the possibly of changing interactions between the data.
data groups:
commodities
interest rates
volatility
central banks
high frequency economic data
stock price movement
This is the basic structure of this analysis. So let’s start and have a look at the data.
2 Spotlights - market implied regimes
In this macro regime update we take another look at Sweden and show some additional information. For the updates, you get Mexico and the global average of all 30+ countries. Mexico is currently in a shallow disinflation regime at 55.3% with low weekly and monthly macro momentum. Therefore, it is classified as a short position. For the mean of the global regime score, we see a disinflation regime at 35.2%, but the growth probability is close to 50% or neutral. What seems pretty clear is the probability of falling inflation, which is currently at 37.7%, based on the trend dynamics of the annual change in the consumer price index.
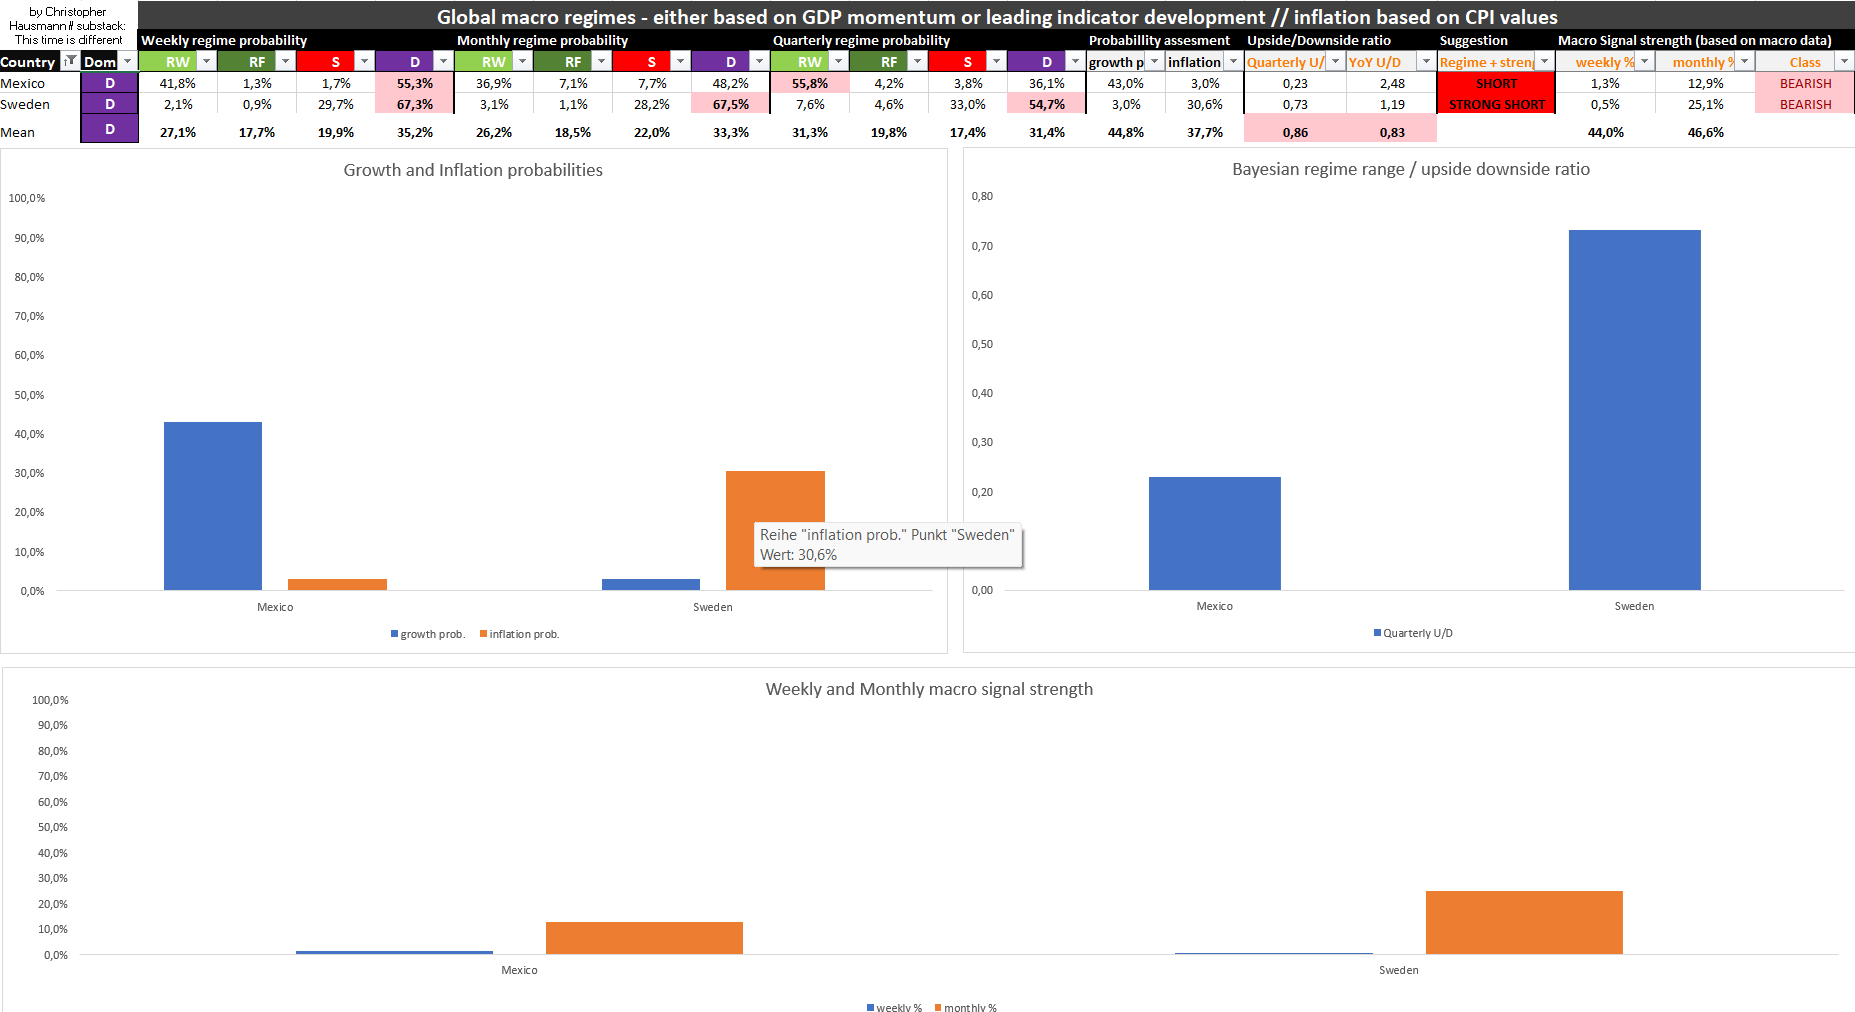
Spotlight: Sweden
Sweden should have been a canary in the coal mine, but recent developments do not point to a strain on the economy. See the economic data at the end of the article for some indicators of the current state. The market data point to a disinflation regime, based on GDP dynamics, after some jumps between real growth and stagflation.
Sweden weekly regime probabilities
Sweden growth probability
After a recent rise to around 60%, the probability of growth in Sweden has fallen again. This was mainly due to asset yields and the relative strength of price momentum, which has declined for the time being. The yield curve is largely inverted, which should also play a role, especially if the general economic data do not look good.
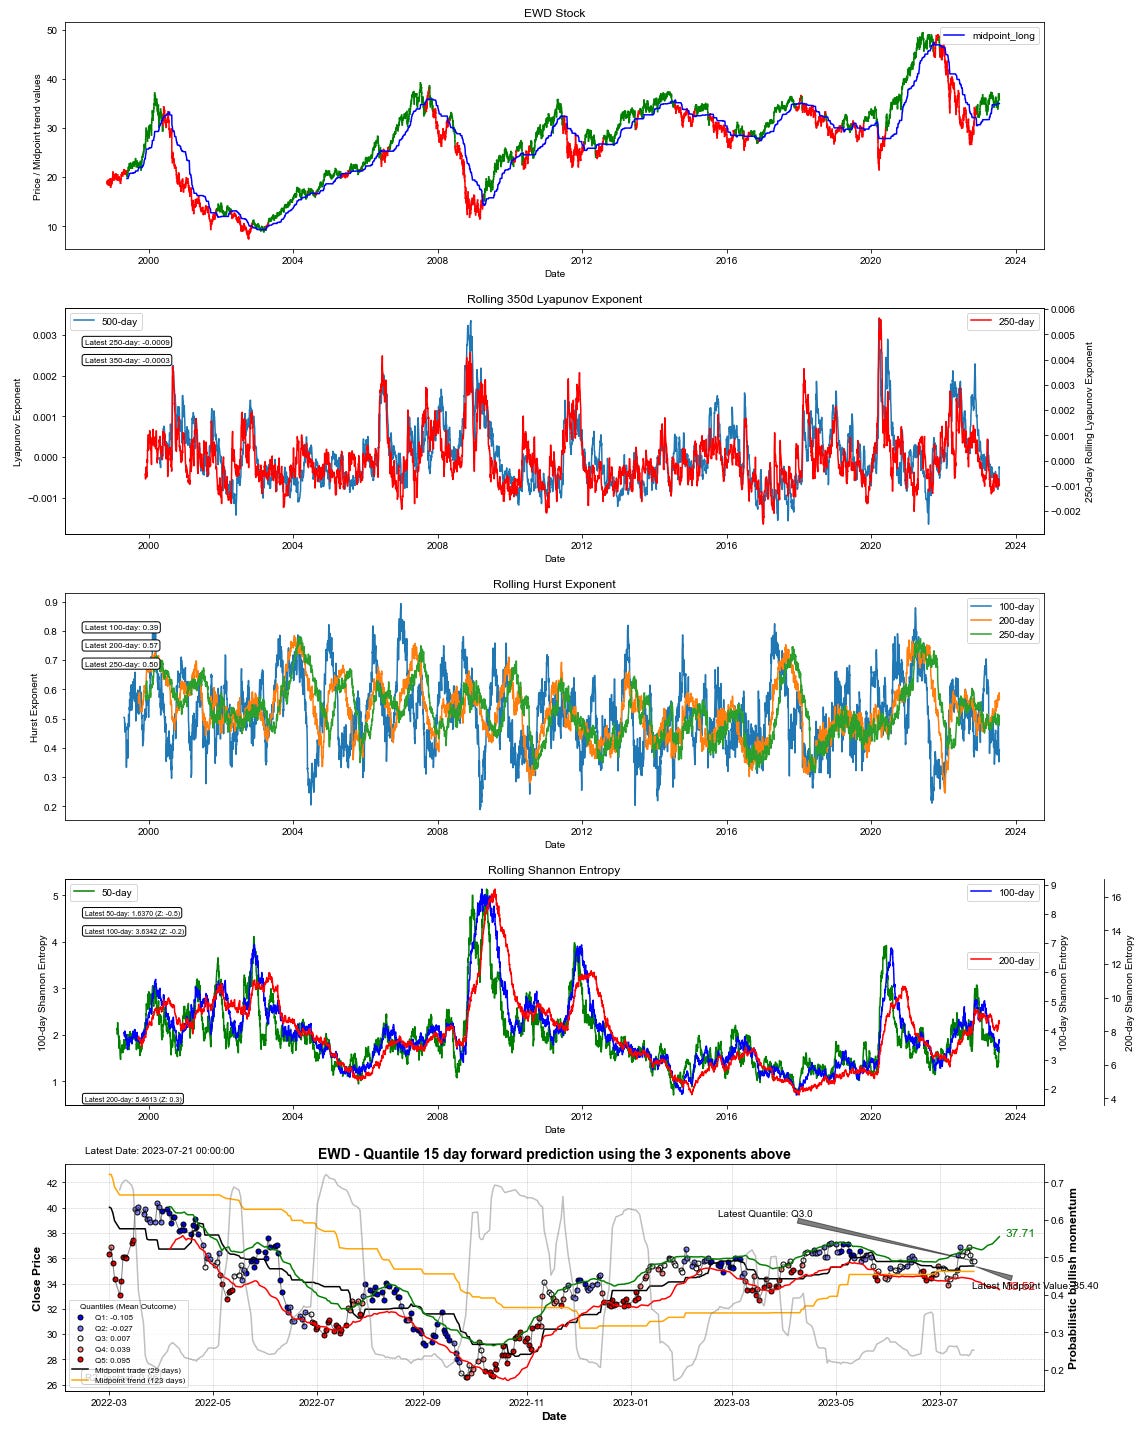
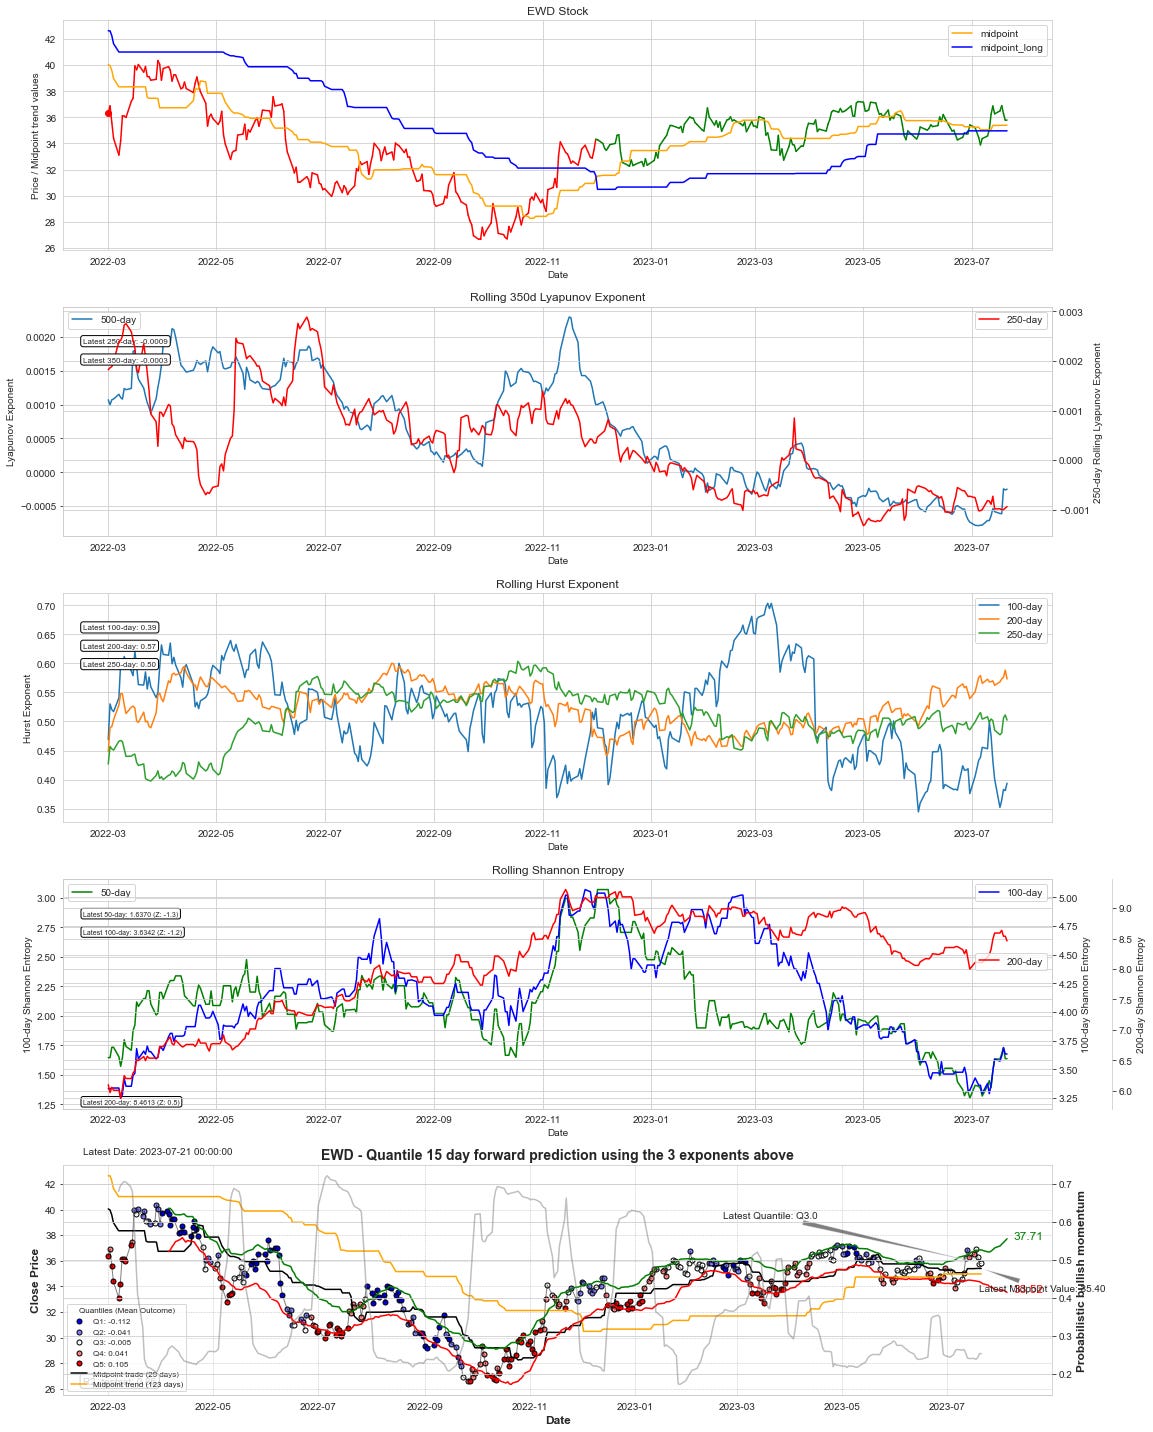
EWD - ETF analysis
Below you can see the new and improved model. Currently, we see that the stock has bullish momentum (color coding of the price). Lyapunov exponents are low, signaling a calm environment. Hurst exponents are down, but the 200-day and 250-day time frames are gaining momentum. For the forward yield, we are currently seeing mean reversion, or quantile 3 pressure. The upside probability is also relatively low and does not suggest excessive forward yields.
latest 350 days:
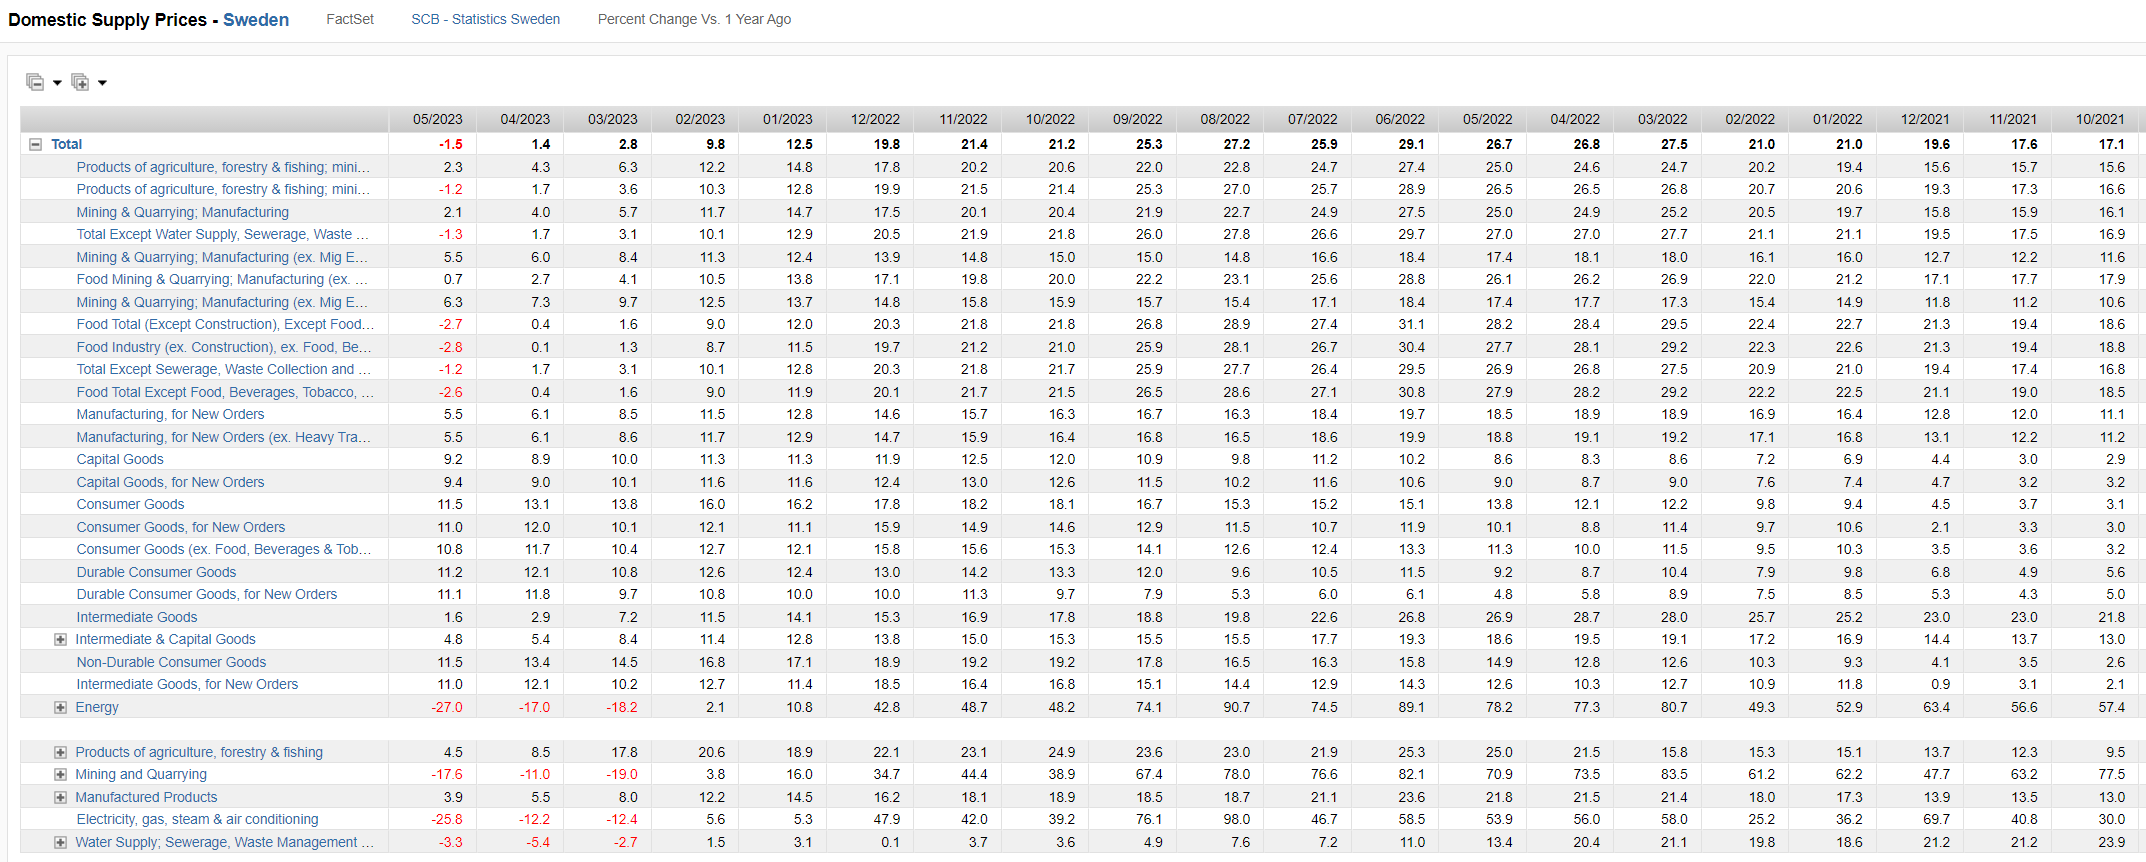
Sweden - macro points
Below you can see domestic prices on the supply side, as Sweden is still struggling with a rather high inflation rate. From this, you can see that domestic consumer goods prices are still heavily influenced by rising supply-side cost increases. The cost of energy production has fallen massively, which is also reflected in electricity prices. Due to this supply-side mechanism, it is likely that the Swedish CPI will continue to rise.
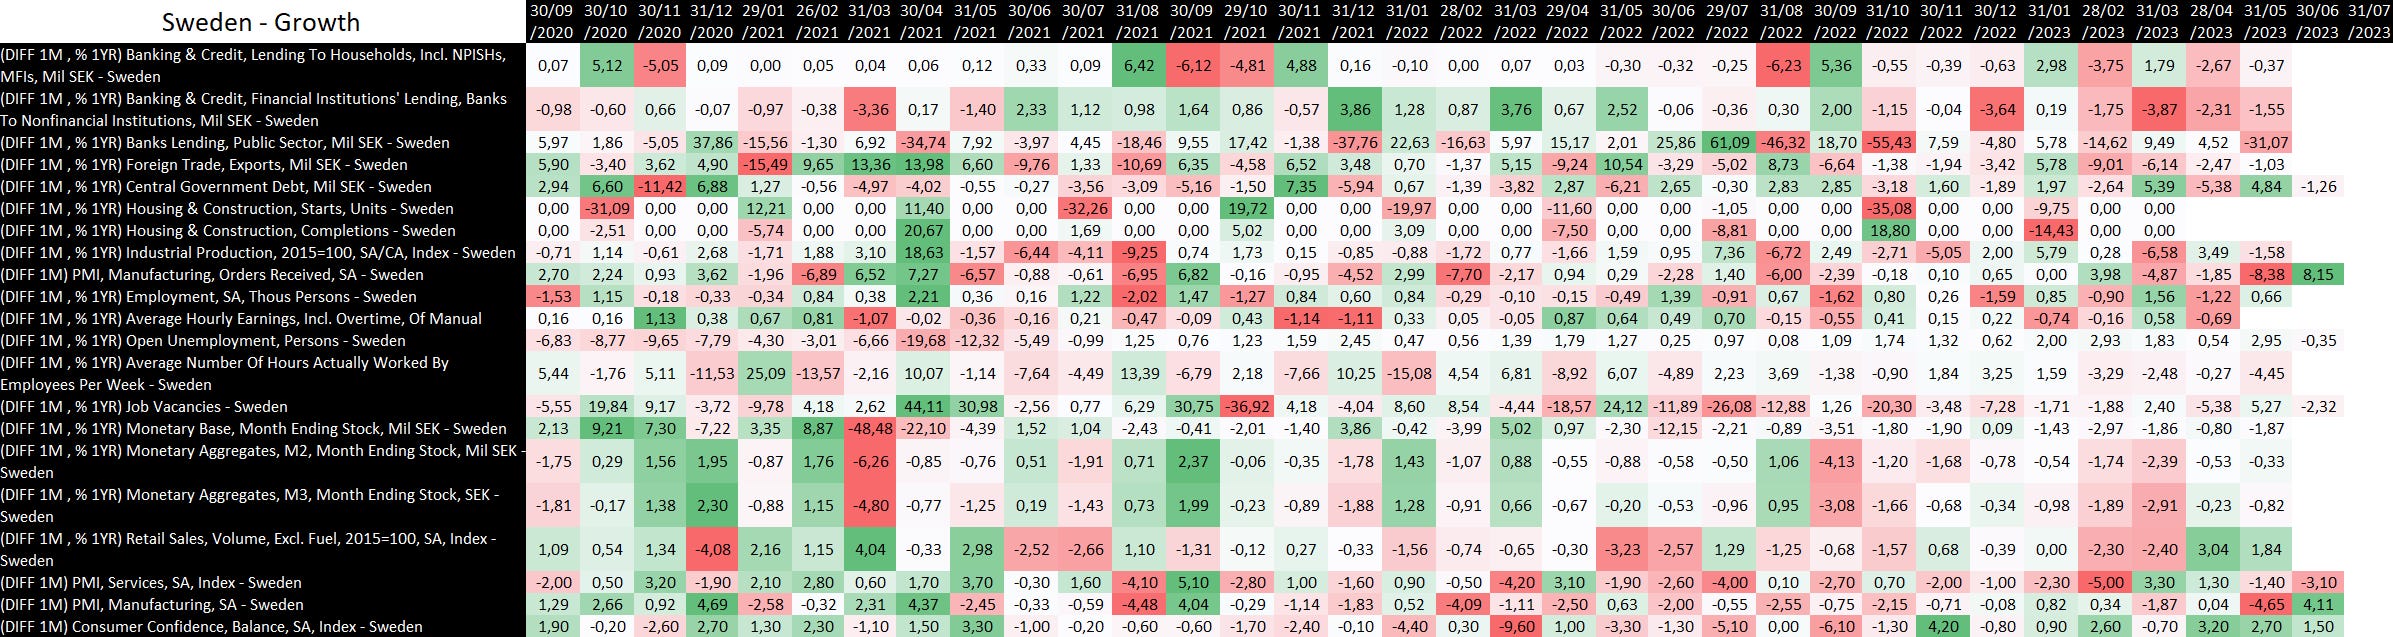
Sweden growth data
Below you can take a look at the 1 month difference of the yearly change in some of Sweden growth indicators.
Yearly coupon:
monthly coupon:
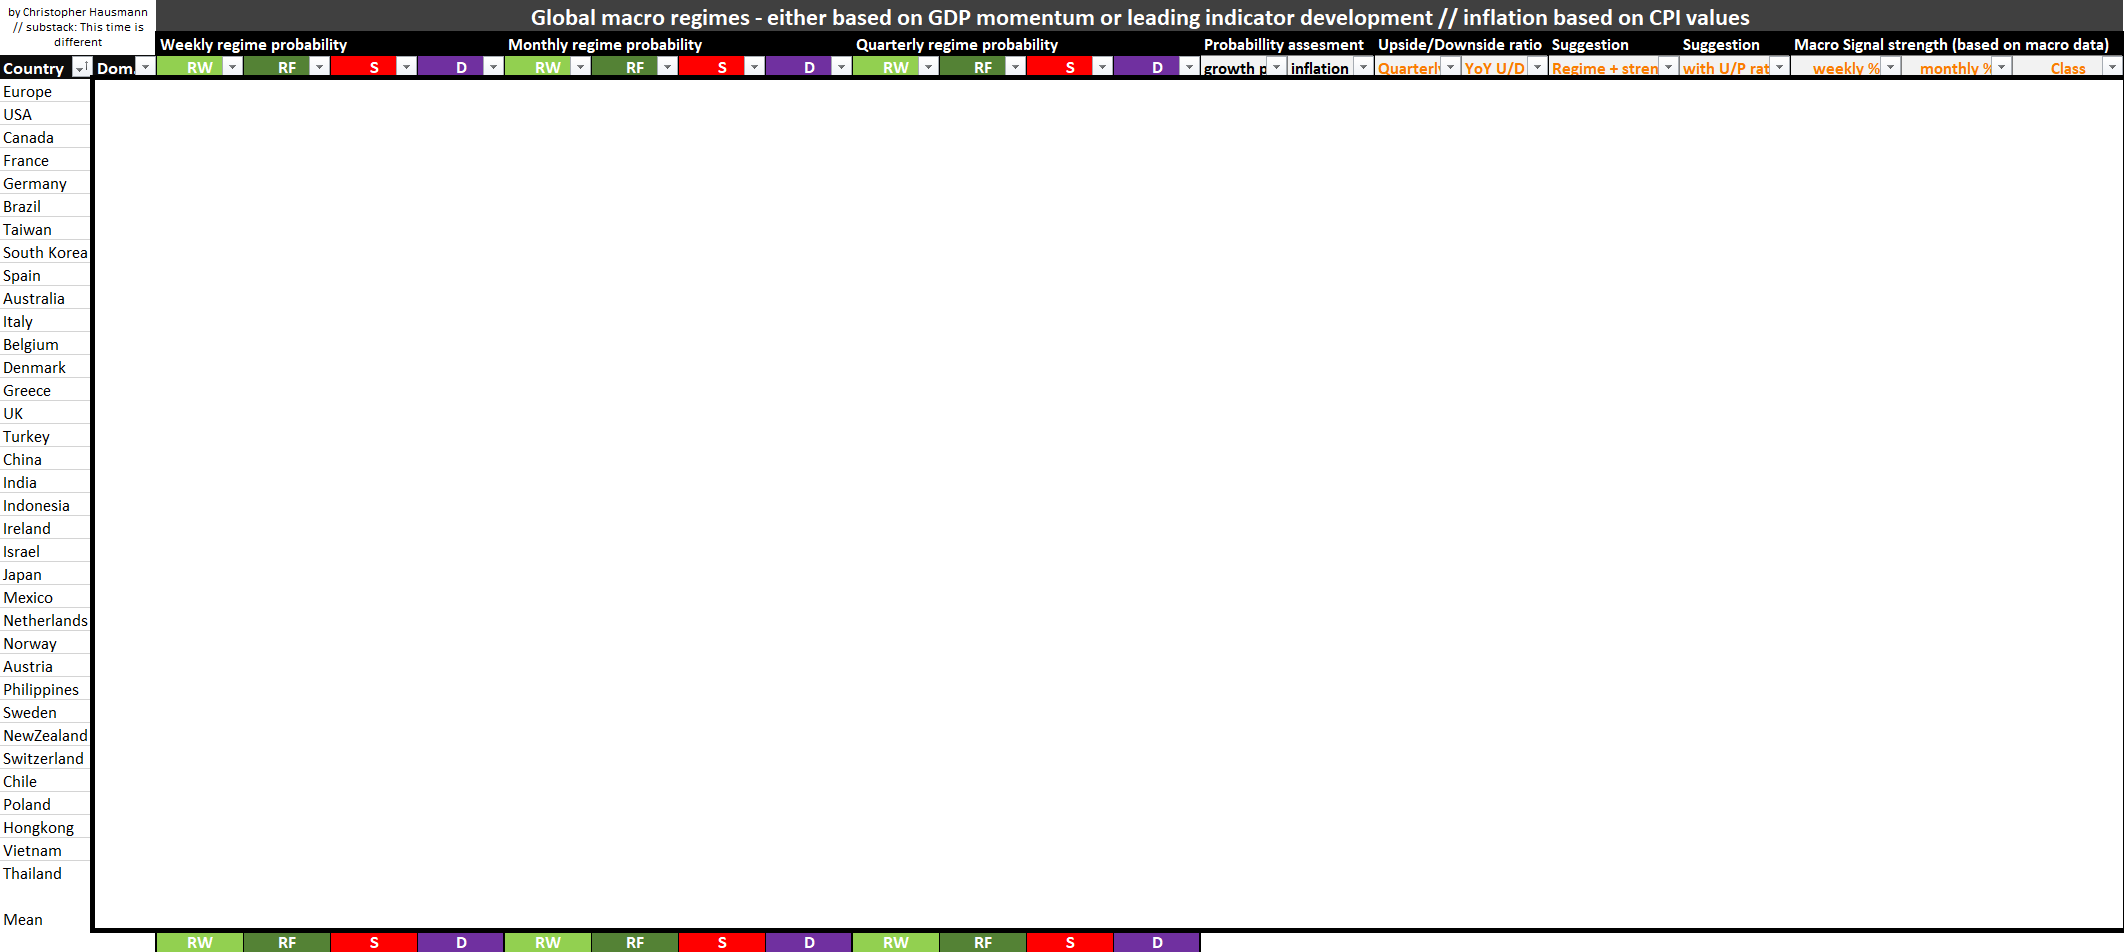
Below you can see the template, which represents the overview of the 30+ countries and is an essential part of the weekly analysis.
Global macro overview:
Keep reading with a 7-day free trial
Subscribe to This Time is Different to keep reading this post and get 7 days of free access to the full post archives.