This Content is intended for educational purposes only. No portion of this Content purports to be, individualized or specific investment advice and is not created to provide investment advice to individuals. All information provided is impersonal, general in nature and is made without regard to individual levels of sophistication or investment experience, investment preferences, objectives or risk parameters and without regard to the suitability of the Content for individuals or entities who may access it. No information found on this Newsletter, nor any Services provided, should be construed as an offer to sell, or a solicitation of an offer to buy any security or investment vehicle, nor should it be construed as tailored or specific to you, or any reader or consumer thereof. You understand and agree that this Content does not constitute specific recommendations of any particular investment, security, portfolio, transaction or strategy, nor does it recommend any specific course of action is suitable for any specific person or entity or group of persons or entities
The macro signal will examine the growth and inflation regime in the context of the market microstructure. That is, the data will not be monthly or quarterly, but daily and weekly. It is more of a high frequency approach given daily/weekly activity. By using machine learning and Bayesian inference, it is possible to get a pretty good signal out of large data sets.
What data goes into this regime classification? I try to put together a structure from all possible angles to account for the interactions between different variables. Every week the model gets retrained to keep up with the possibly of changing interactions between the data.
data groups:
commodities
interest rates
volatility
central banks
high frequency economic data
stock price movement
This is the basic structure of this analysis. So let’s start and have a look at the data.
2 Spotlights - market implied regimes
In this macro regime update we take a look at Europe and Spain. For Europe, there is an additional section with more information than the regime data. Spain is currently in reflation with a probability of 69.6%. The growth and inflation probabilities are well above the 50% mark, and the general recommendation is currently to be strongly long. The index (IBEX 35) and the EWP ETF for Spain are more or less trapped in a mean reversion, i.e. a sideways pattern.
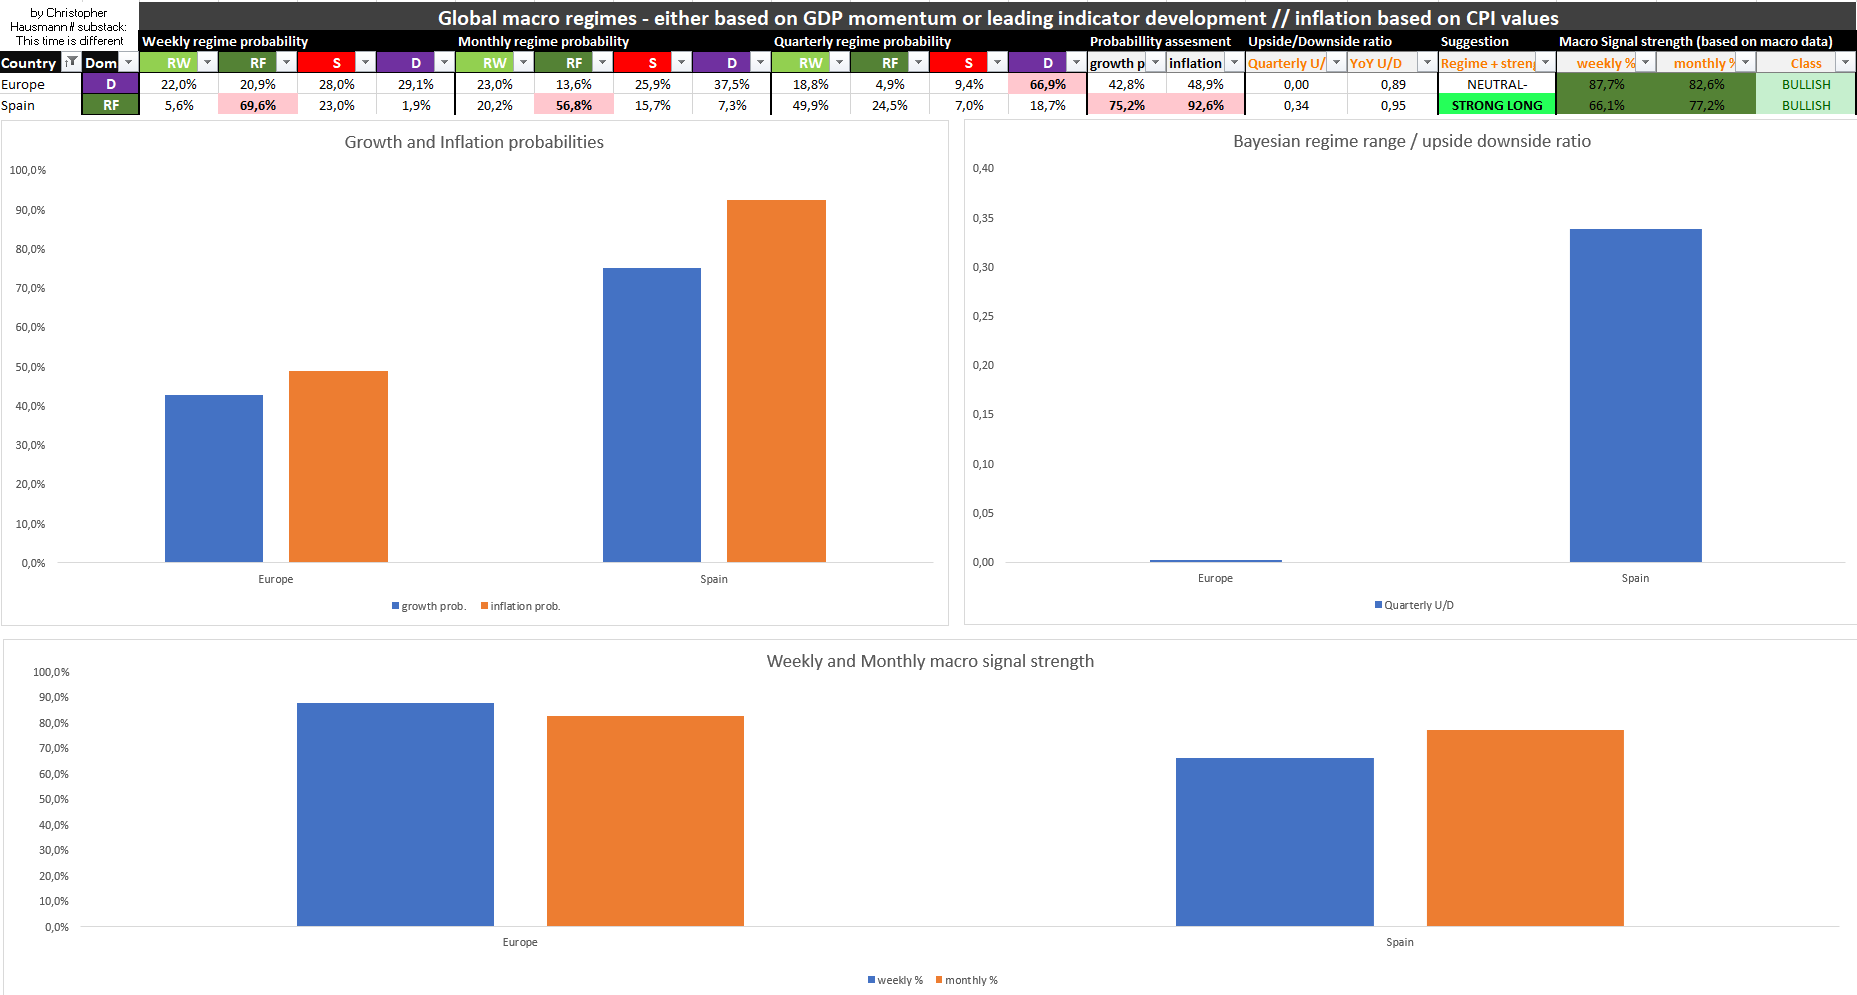
Spotlight: Europe
Europe has seen strong upward momentum in equity prices since early 2023. Based on the GDP regime assessment (direction of GDP growth), the Eurozone is currently in disinflation, but the regime probabilities are all currently around the 25% mark, where we would suggest an equal distribution of all regimes.
Europe weekly regime probabilities
This plot illustrates the idea better, as all plots are closer together within a probability distribution with the same regime.
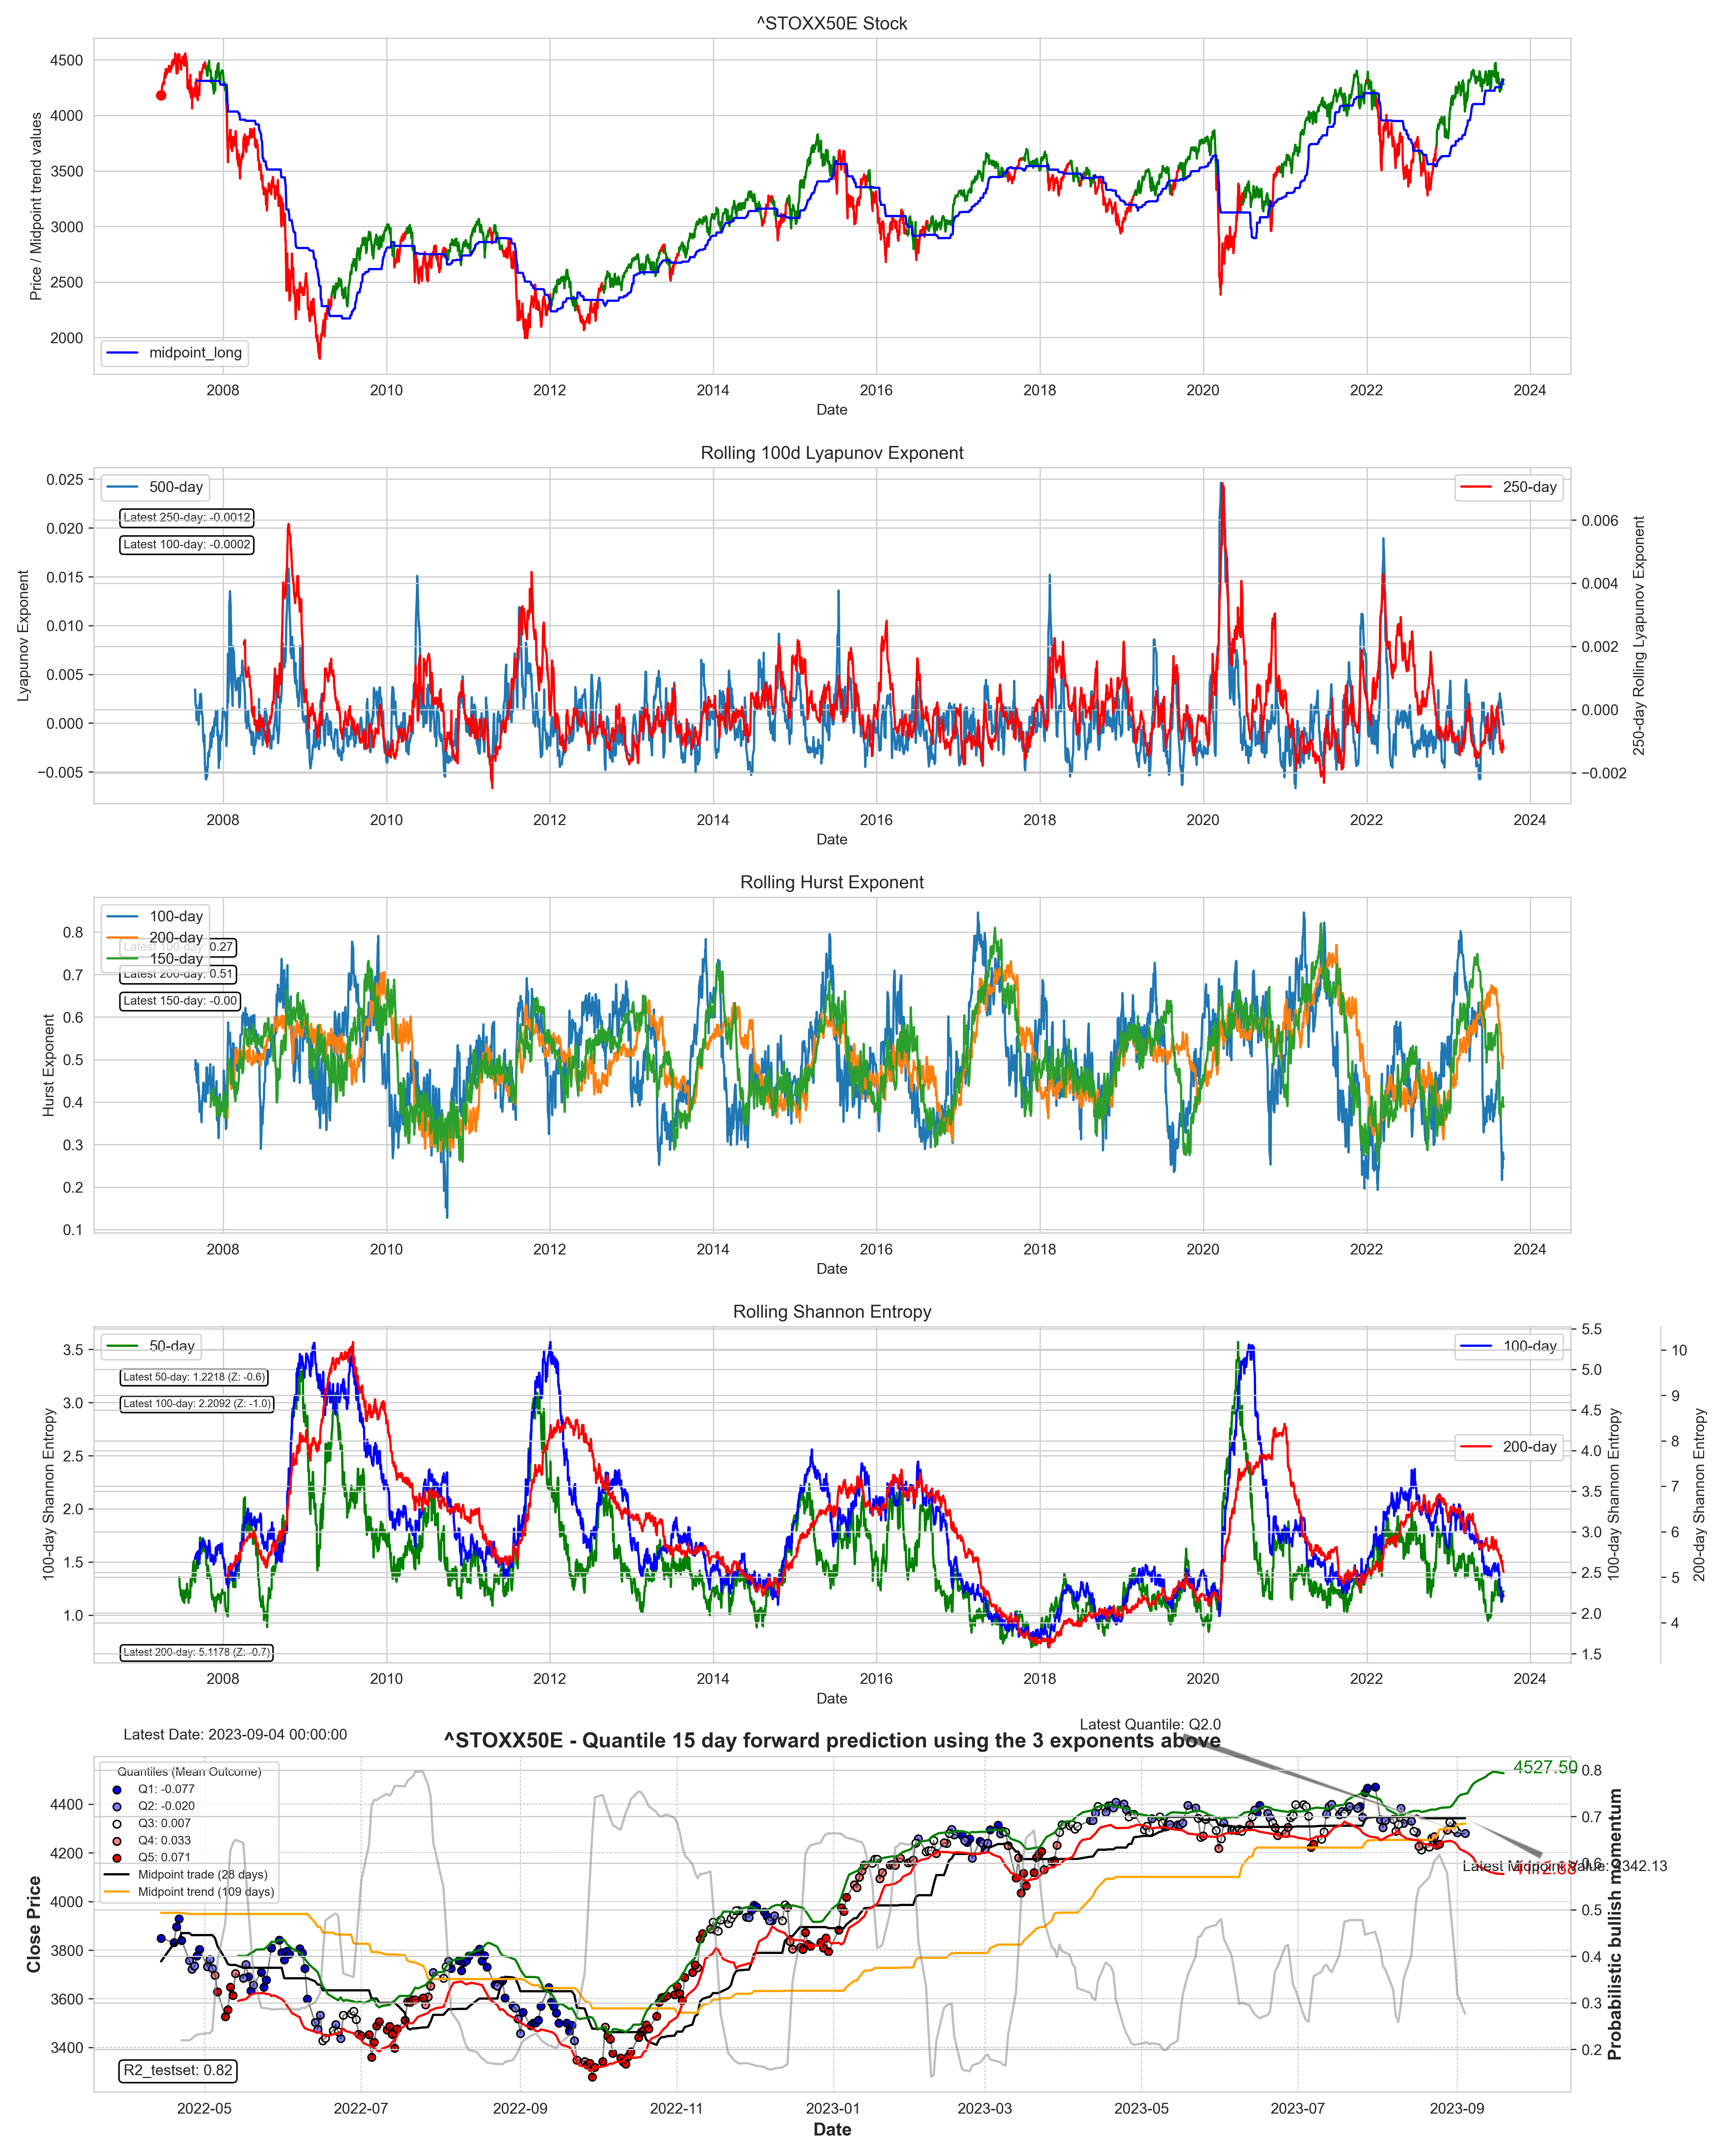
STOXX50 - analysis
Below you can see the STOXX50 index, which is currently in an upward trend (first partial chart). This means that the short-term mean is above the medium-term mean and the index offers an upward price system. Using the Hurst exponents, we can see that all the different rolling time frames are heading towards the antipersistence level, where the probability of short-term price reversals is higher. The future yield structure does not suggest decent returns over the next 15 days, and the trend is more sideways.
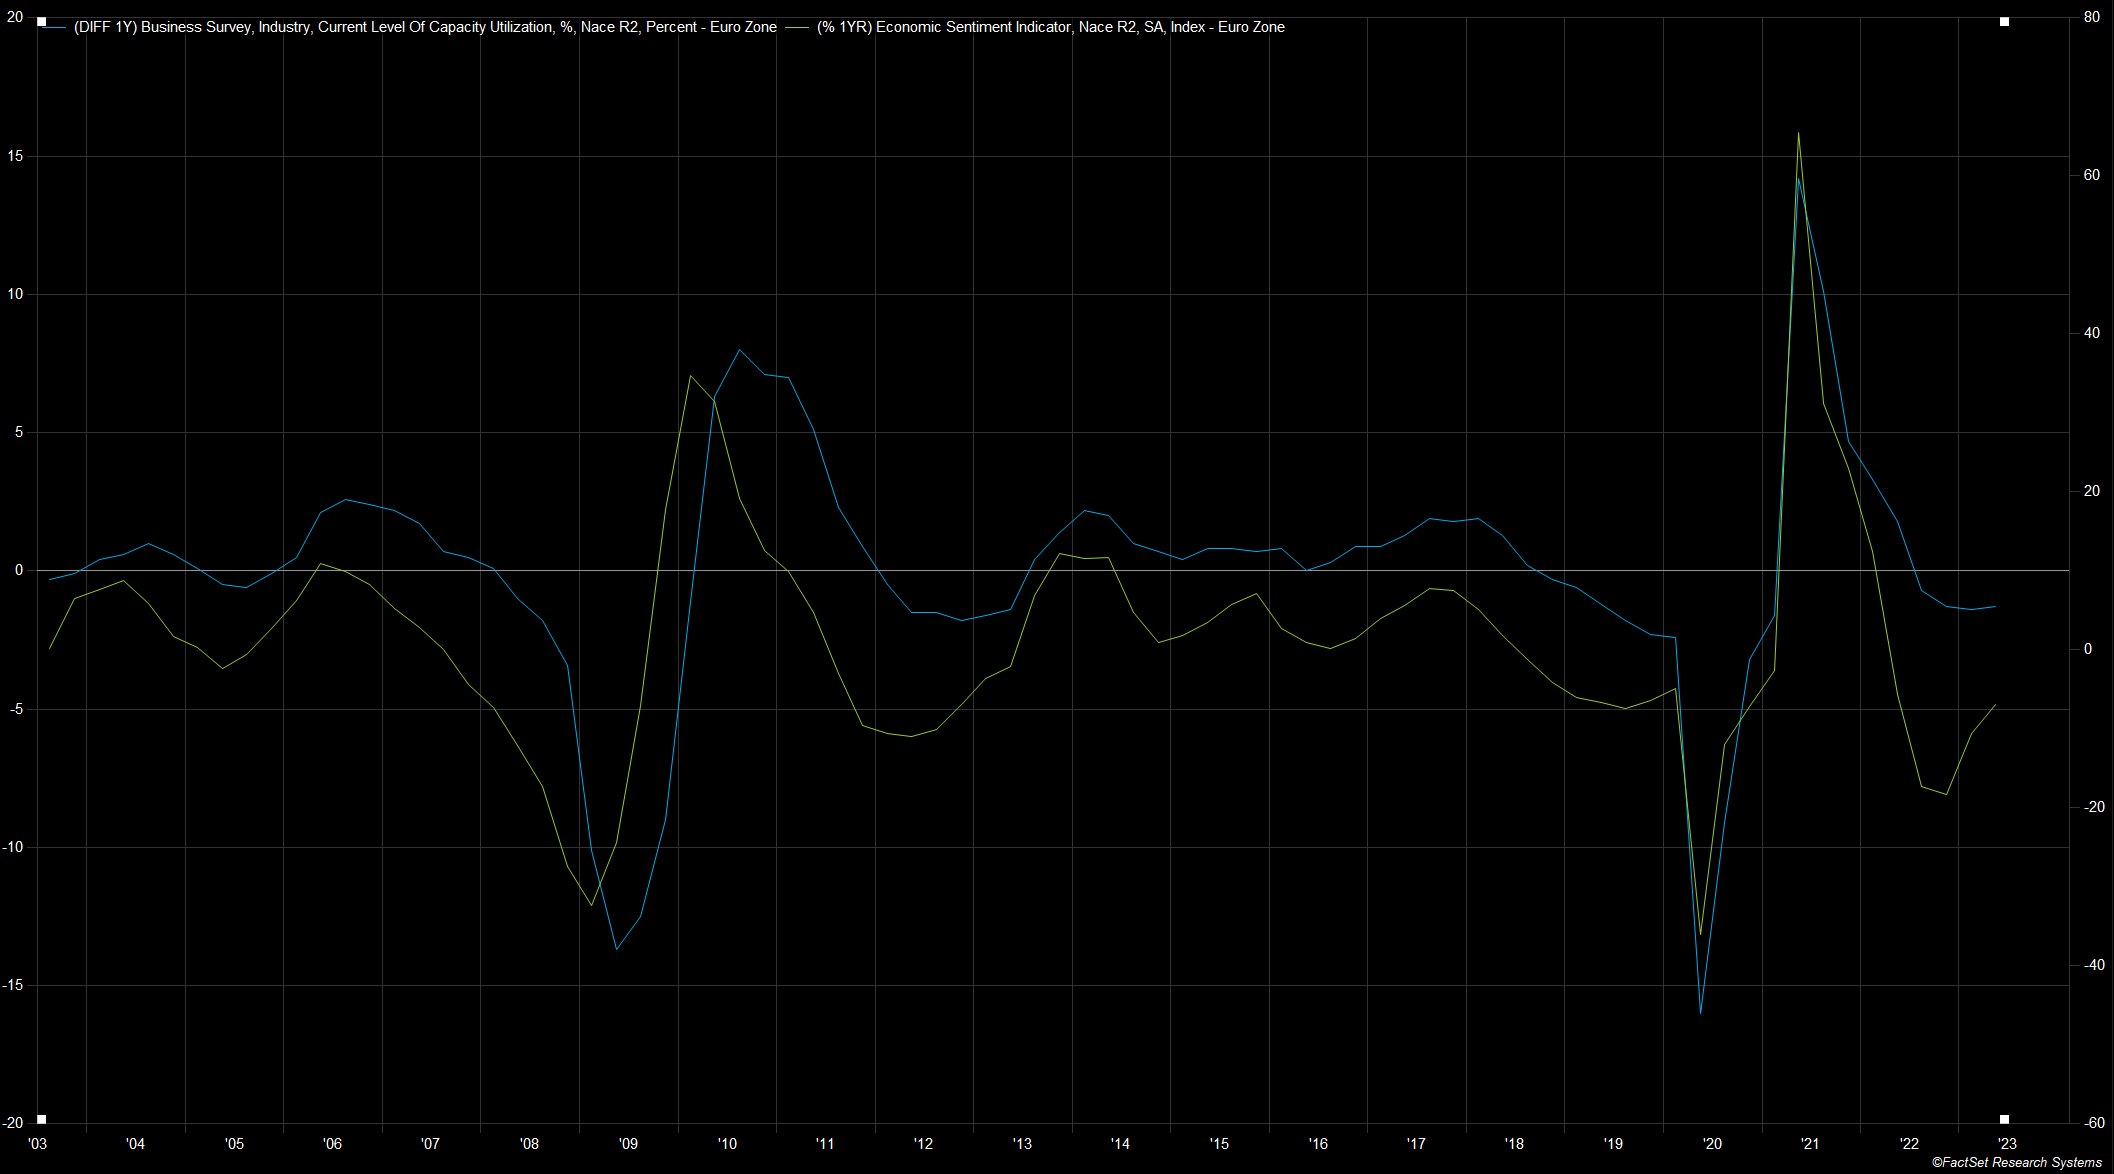
Europe - capacity utilization
Capacity utilization is a focal series because it is related to supply-side inflation and the aggregate demand function within an economy. There is no recession without a massive drop in capacity utilization and no boom without an increase in capacity utilization. Although the economic sentiment indicator is a soft indicator, it is quite useful for assessing the change in direction of capacity utilization because the sentiment indicator tends to change course 1-2 months earlier. At this point in time, the sentiment is slightly increasing if we look at the dynamics. Therefore, it could be likely that capacity utilization is moving towards the 0 line, where we would see a medium result and stable values of the percentage indicator (capacity utilization).
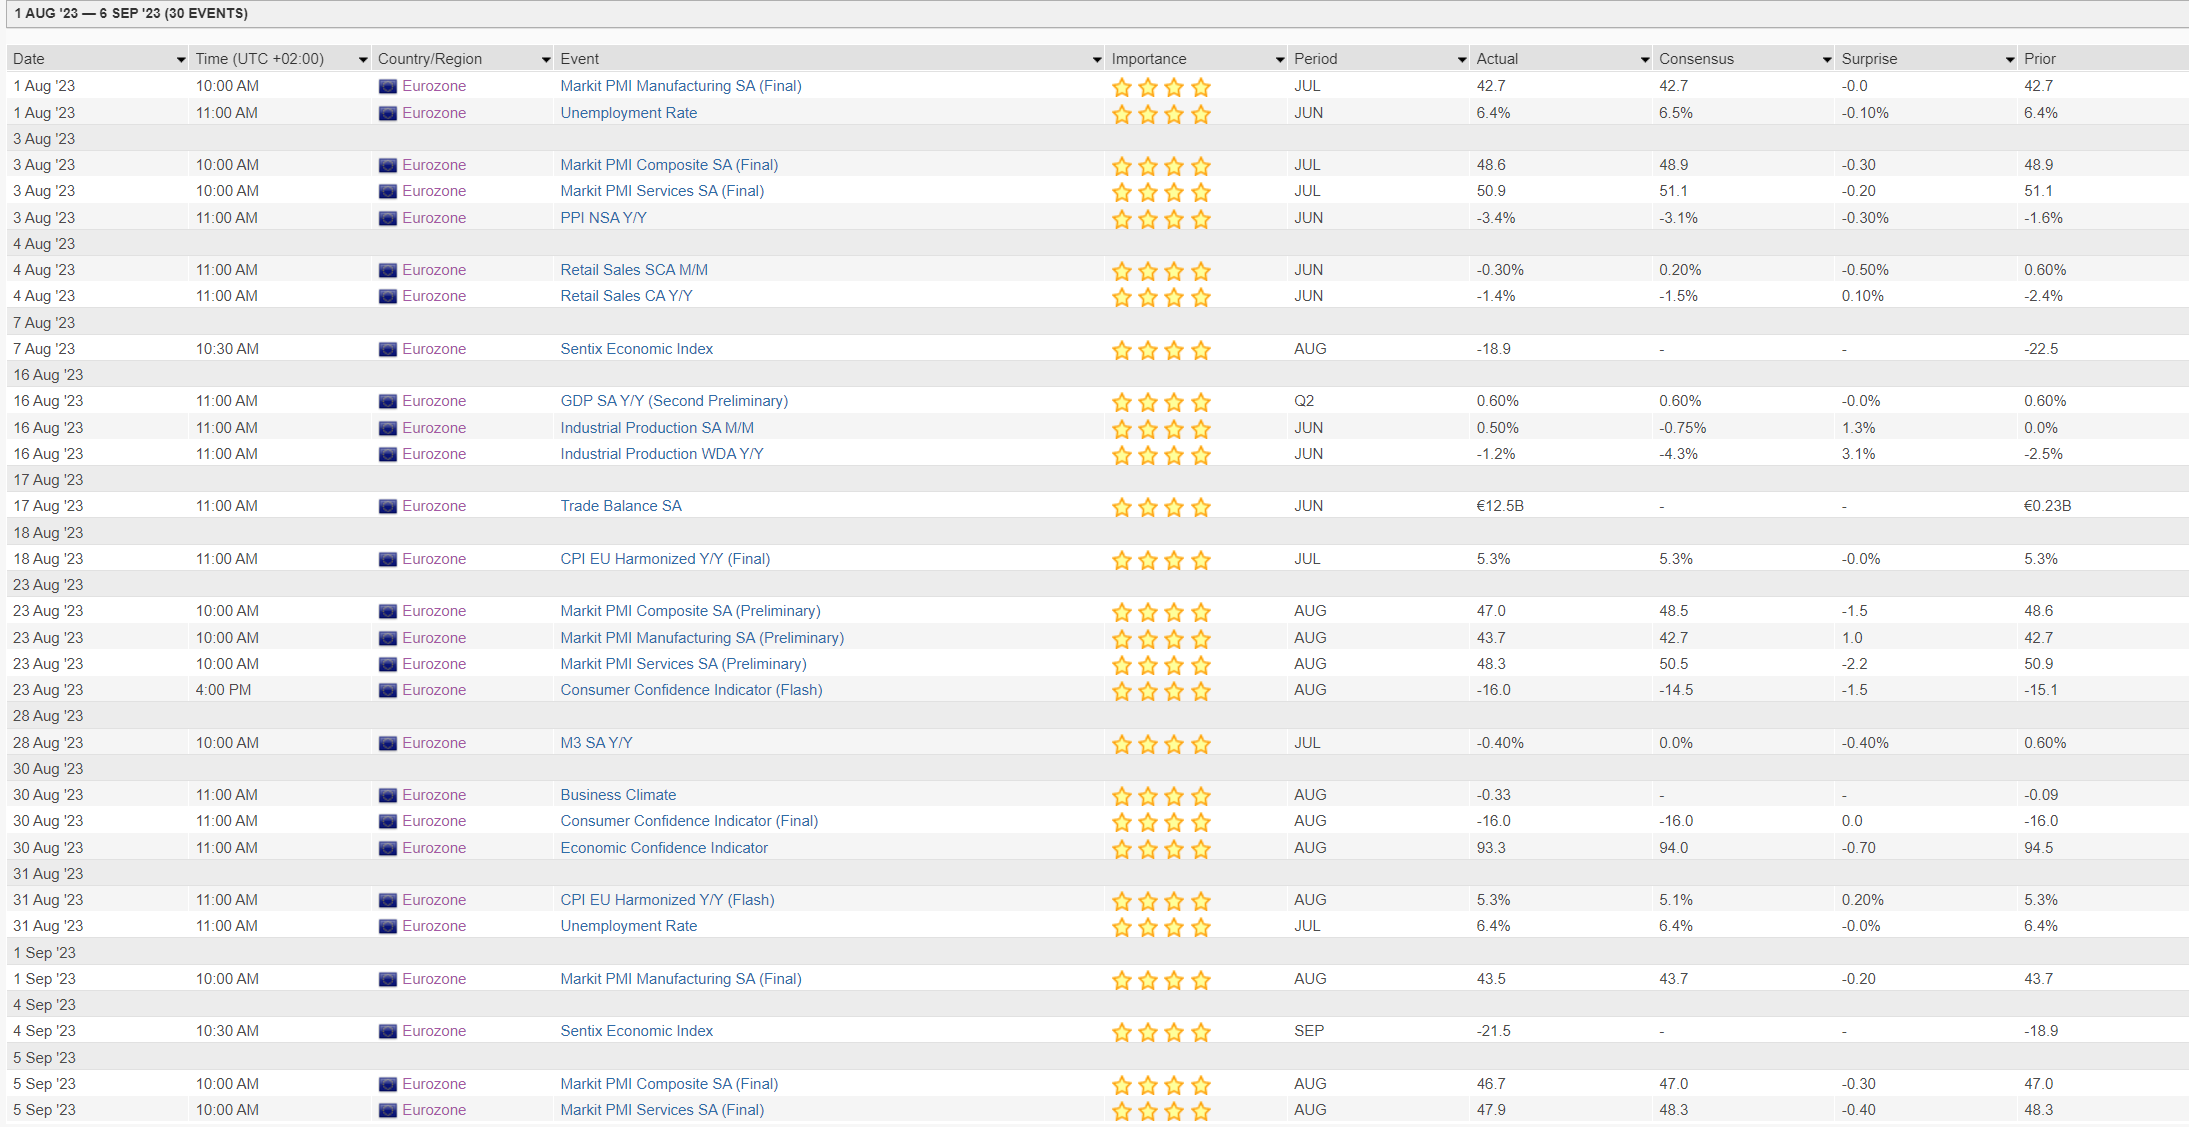
Europe - latest macro data
Below you can see the latest macro release data for the Euro Zone.
Yearly coupon:
monthly coupon:
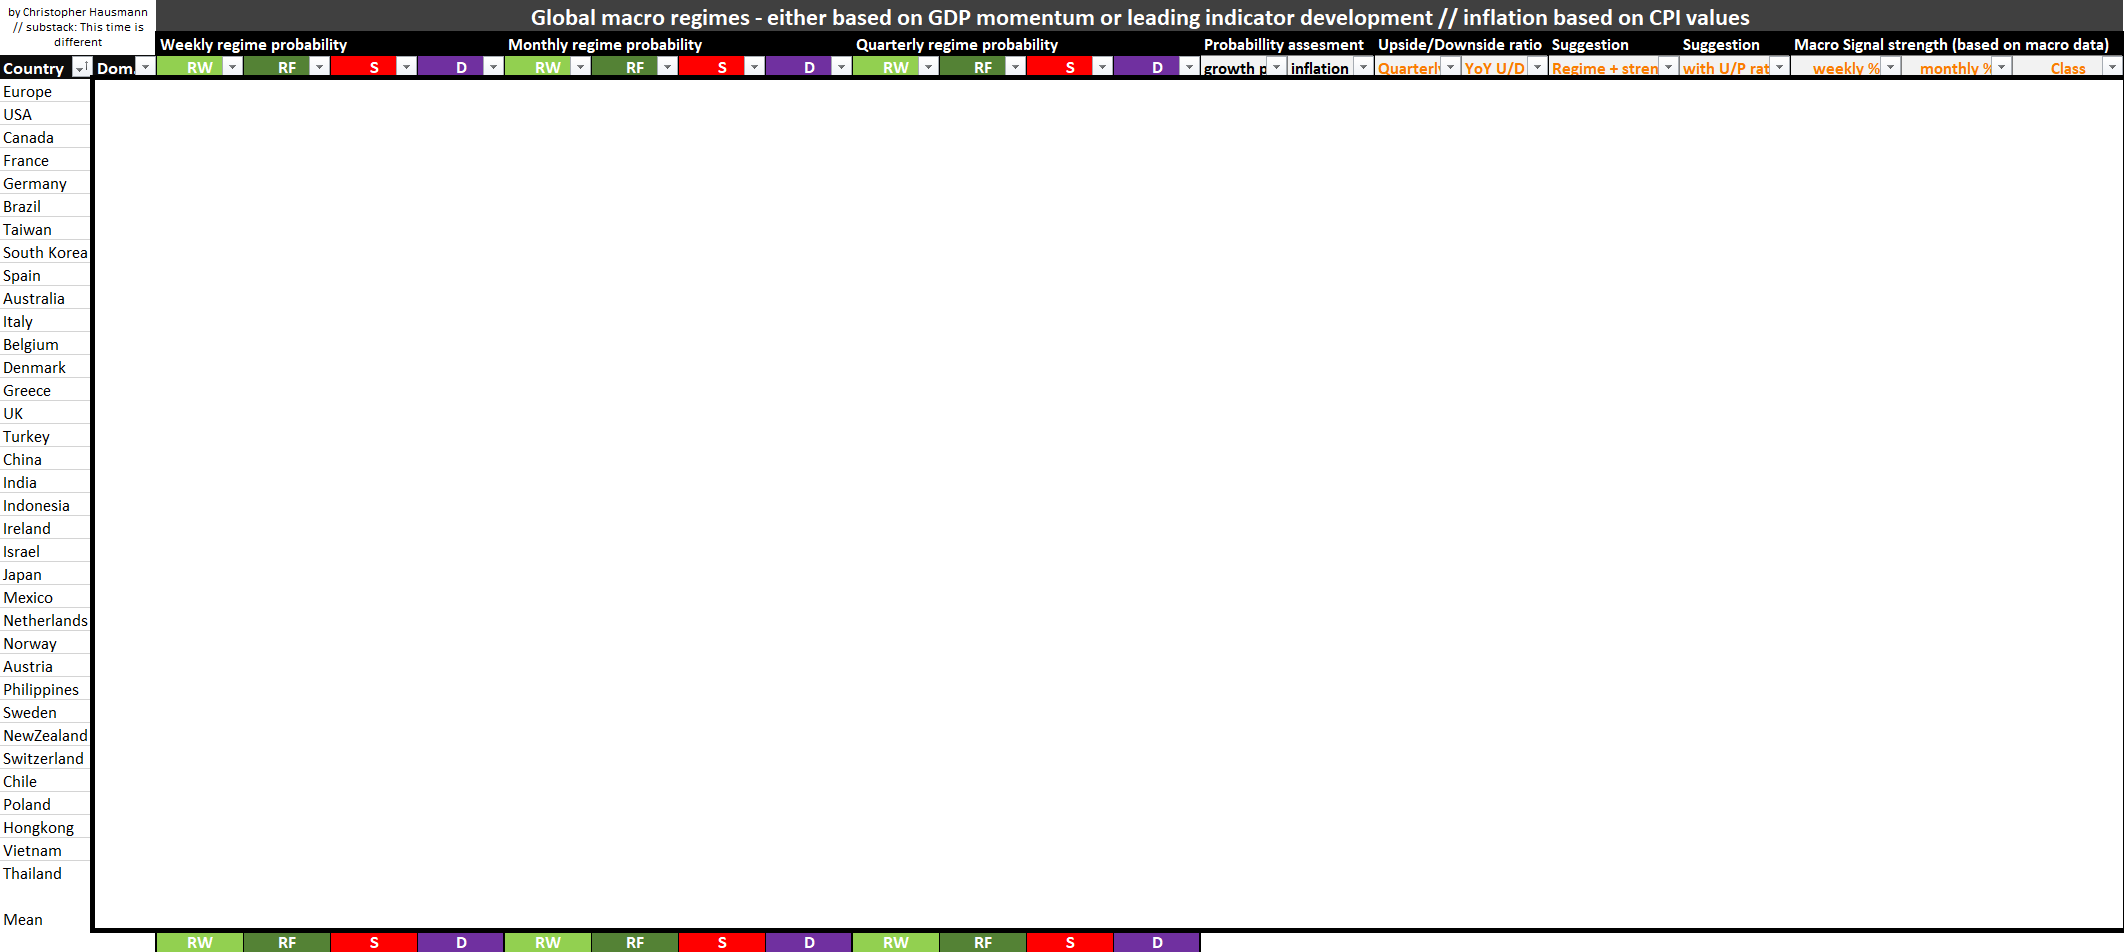
Below you can see the template, which represents the overview of the 30+ countries and is an essential part of the weekly analysis.
Global macro overview:
Keep reading with a 7-day free trial
Subscribe to This Time is Different to keep reading this post and get 7 days of free access to the full post archives.