This Content is intended for educational purposes only. No portion of this Content purports to be, individualized or specific investment advice and is not created to provide investment advice to individuals. All information provided is impersonal, general in nature and is made without regard to individual levels of sophistication or investment experience, investment preferences, objectives or risk parameters and without regard to the suitability of the Content for individuals or entities who may access it. No information found on this Newsletter, nor any Services provided, should be construed as an offer to sell, or a solicitation of an offer to buy any security or investment vehicle, nor should it be construed as tailored or specific to you, or any reader or consumer thereof. You understand and agree that this Content does not constitute specific recommendations of any particular investment, security, portfolio, transaction or strategy, nor does it recommend any specific course of action is suitable for any specific person or entity or group of persons or entities
The macro signal will examine the growth and inflation regime in the context of the market microstructure. That is, the data will not be monthly or quarterly, but daily and weekly. It is more of a high frequency approach given daily/weekly activity. By using machine learning and Bayesian inference, it is possible to get a pretty good signal out of large data sets.
What data goes into this regime classification? I try to put together a structure from all possible angles to account for the interactions between different variables. Every week the model gets retrained to keep up with the possibly of changing interactions between the data.
data groups:
commodities
interest rates
volatility
central banks
high frequency economic data
stock price movement
This is the basic structure of this analysis. So let’s start and have a look at the data.
2 Spotlights - market implied regimes
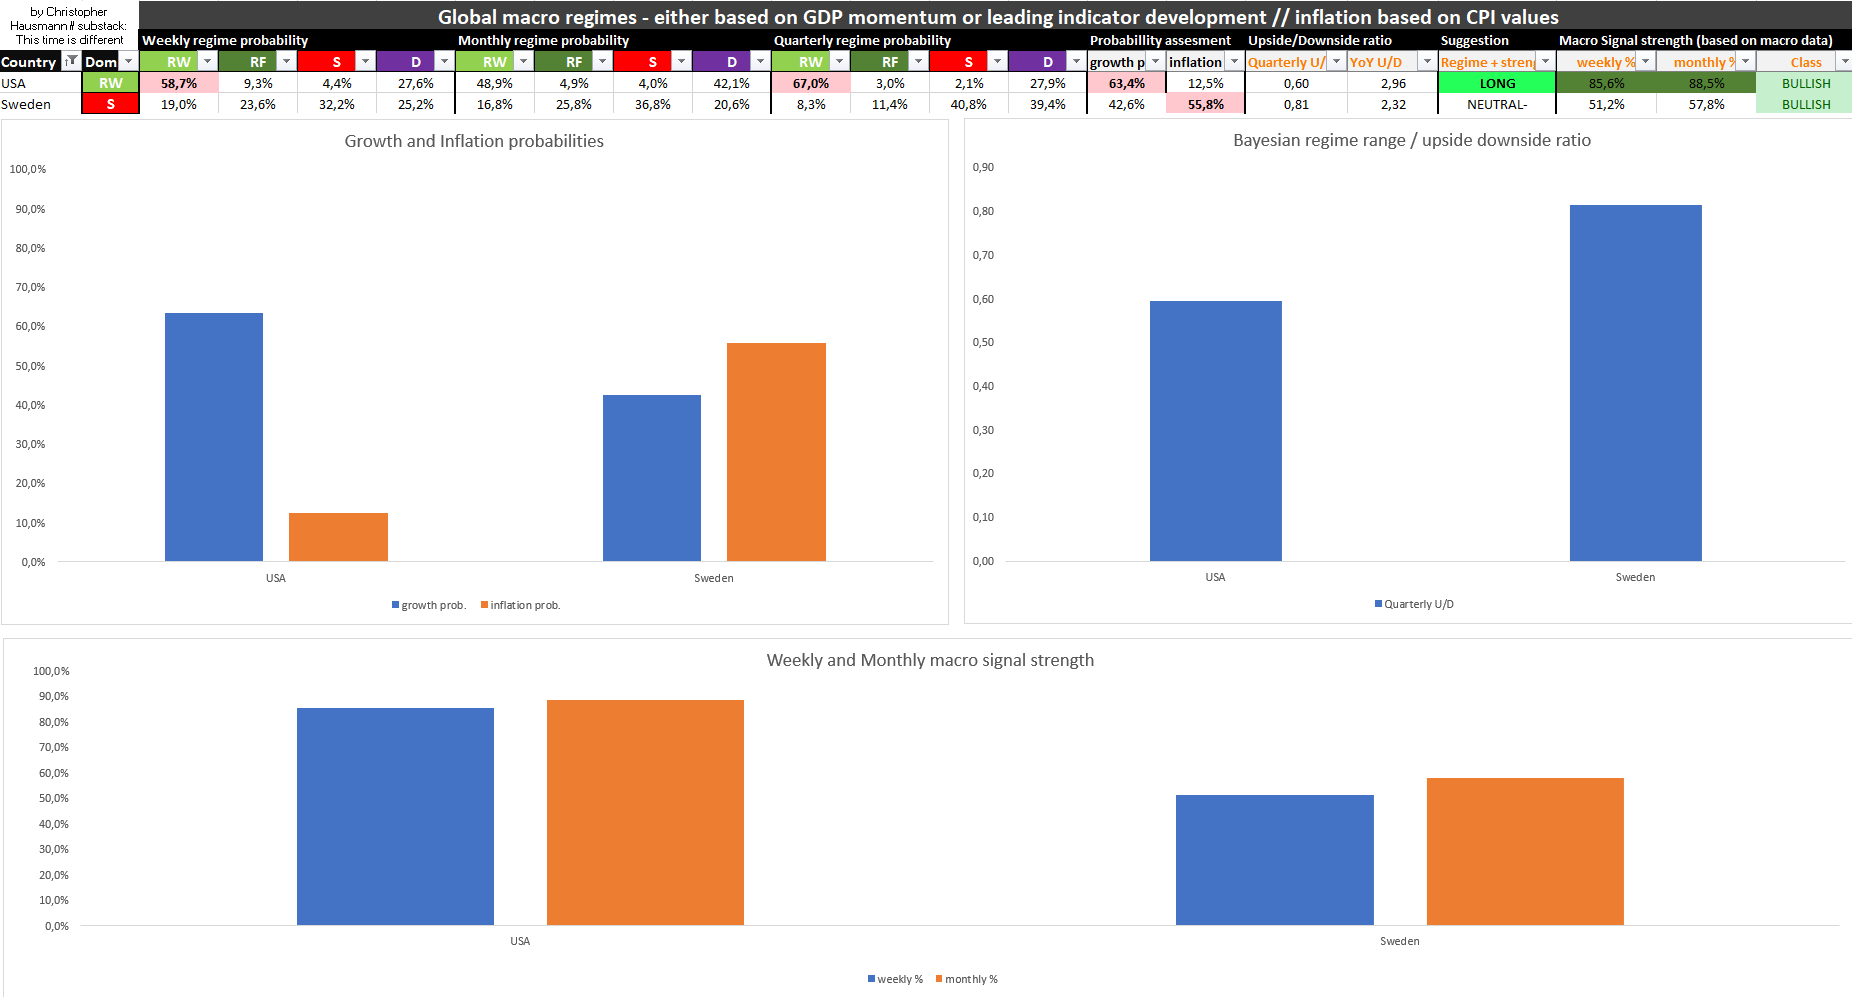
In this macro regime update we take a look at the USA and Sweden. For the U.S.A., there is an additional section with more information than the regime data. Spain is currently in stagflation with a probability of 32.2%. The result is relatively evenly distributed, with a tendency toward lower growth probabilities and higher inflationary pressures. The general sentiment is NEUTRAL-, which means that a short signal is likely imminent.
Spotlight: USA
After dynamically retraining the model after each data update, the model finally switched to a real growth regime, which dates back to april 2023. The historical relationship within the data structure resembled a different regime (nowcasting the last 60 entries or roughly 3 months). So what this basically means, is that the current cycle is unlike others and that certain variables now currently behave otherwise.
USA weekly regime probabilities
Currently we are seeing a dominant outcome for the real growth regime. On a trending basis the rate of change for inflation looks like it is falling (based on the YoY numbers). To be a bit cautious is that, the real growth regime probability is falling from a high level and the disinflation regime probability is still rising. This is most likely the fact, that we are still seeing a deeply inverted yield curve.
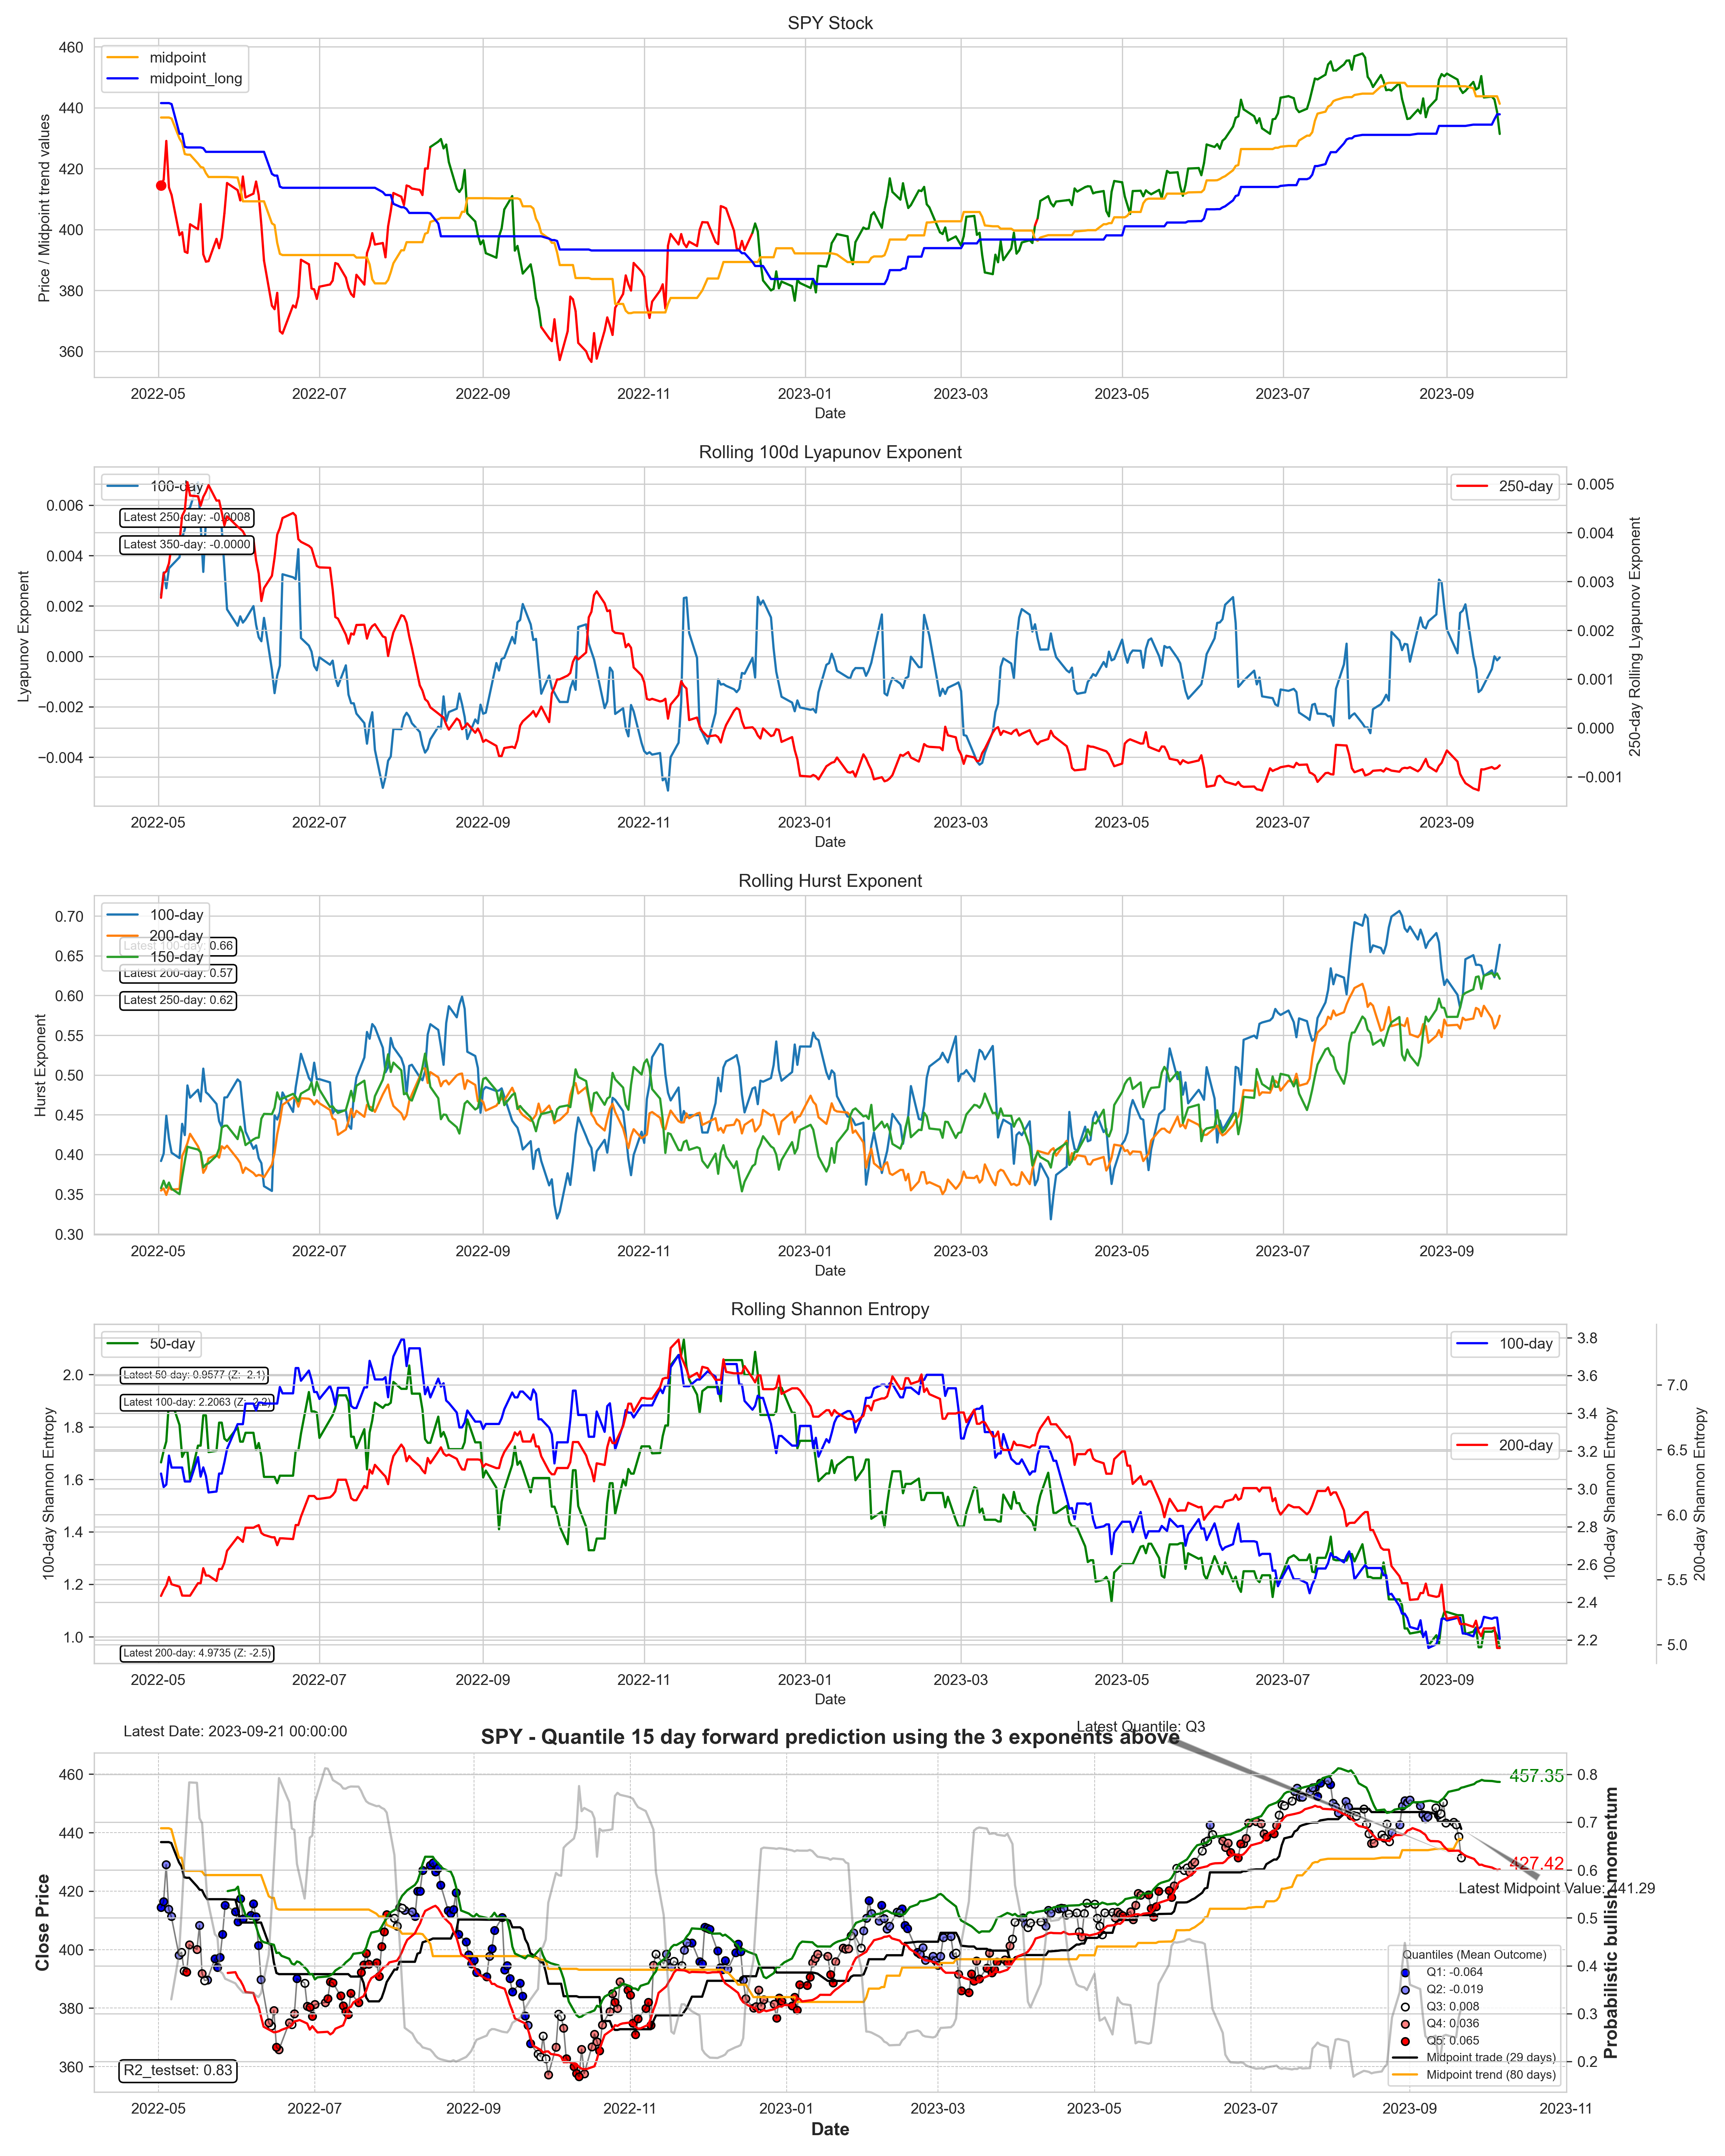
SPY - ETF forward return
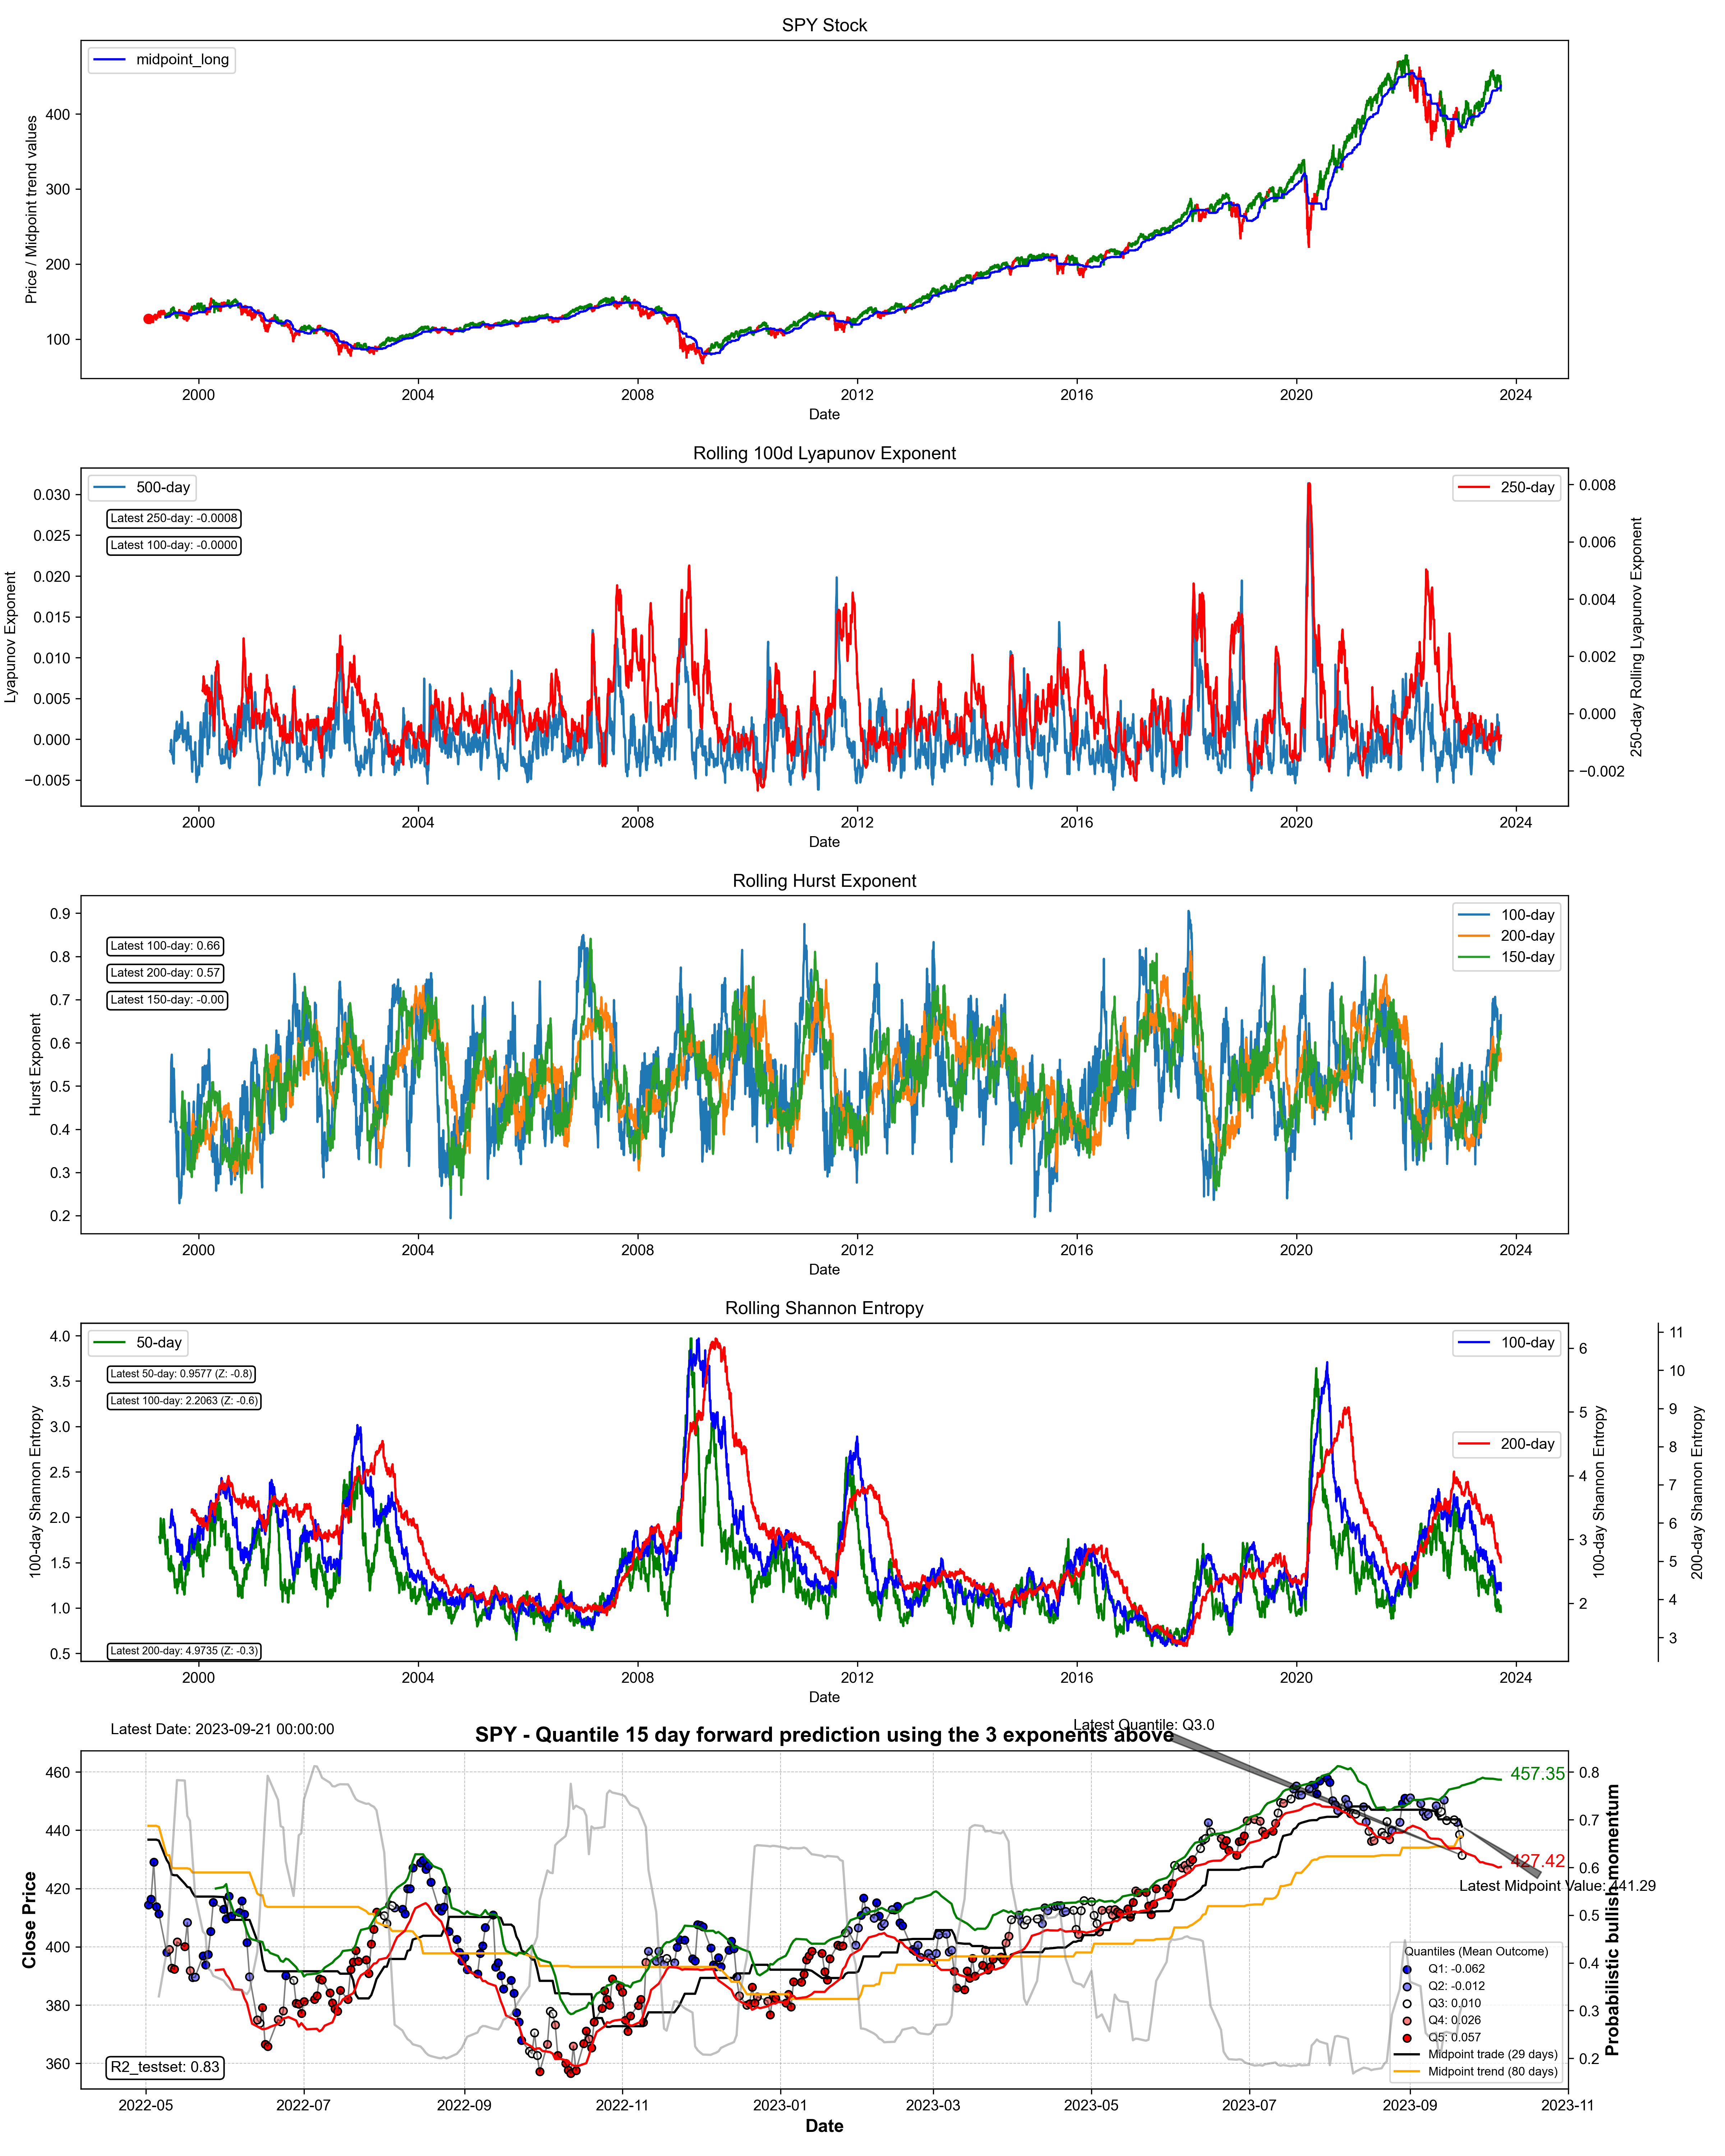
latest 350 days:
Based on the current assessment, it looks like the SPY may be initiating a trend change given the recent price decline. But the midpoint and midpoint long are not signaling this at the moment, and the forward return is structured around a quantile 3 (Q3), implying a mean reversion and a mean 0 return. It looks like the SPY could go sideways, as suggested by the model valuation.
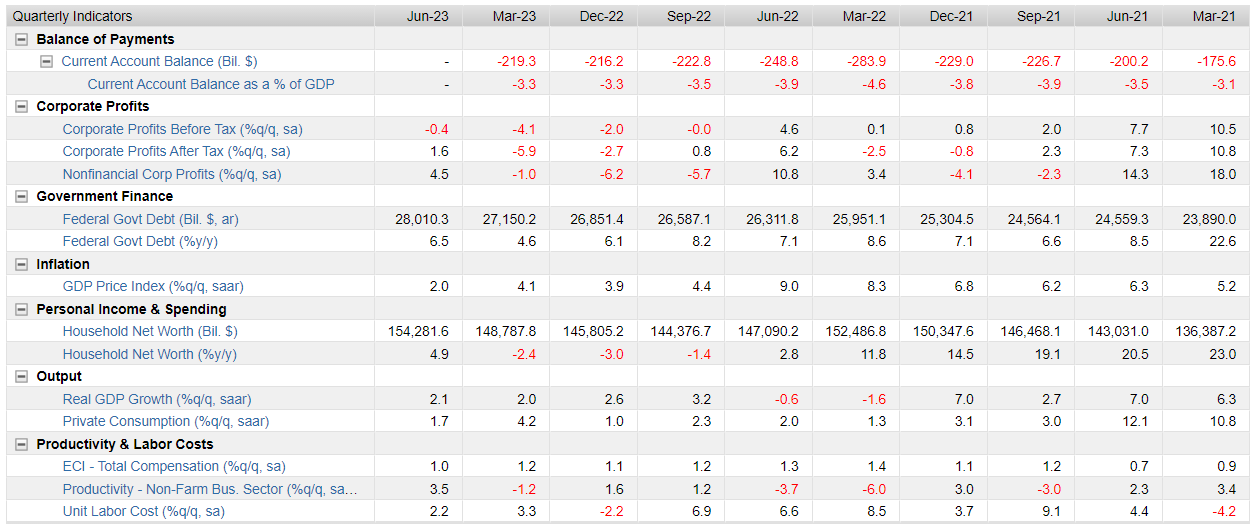
USA - some data to look at
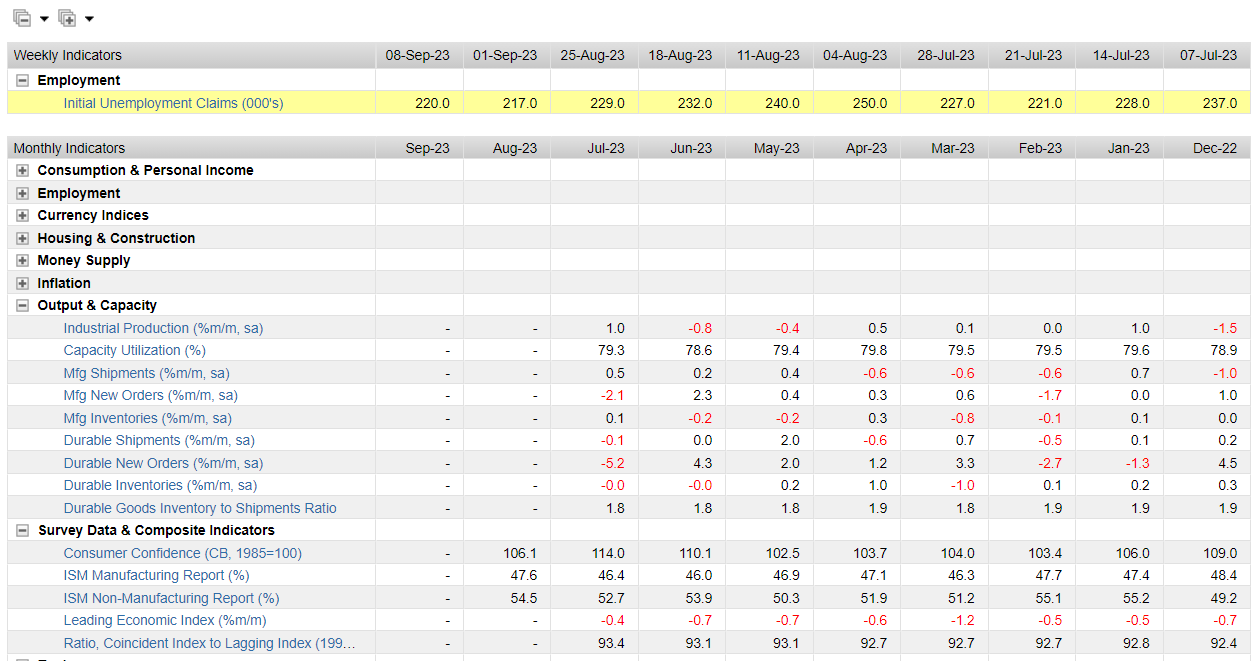
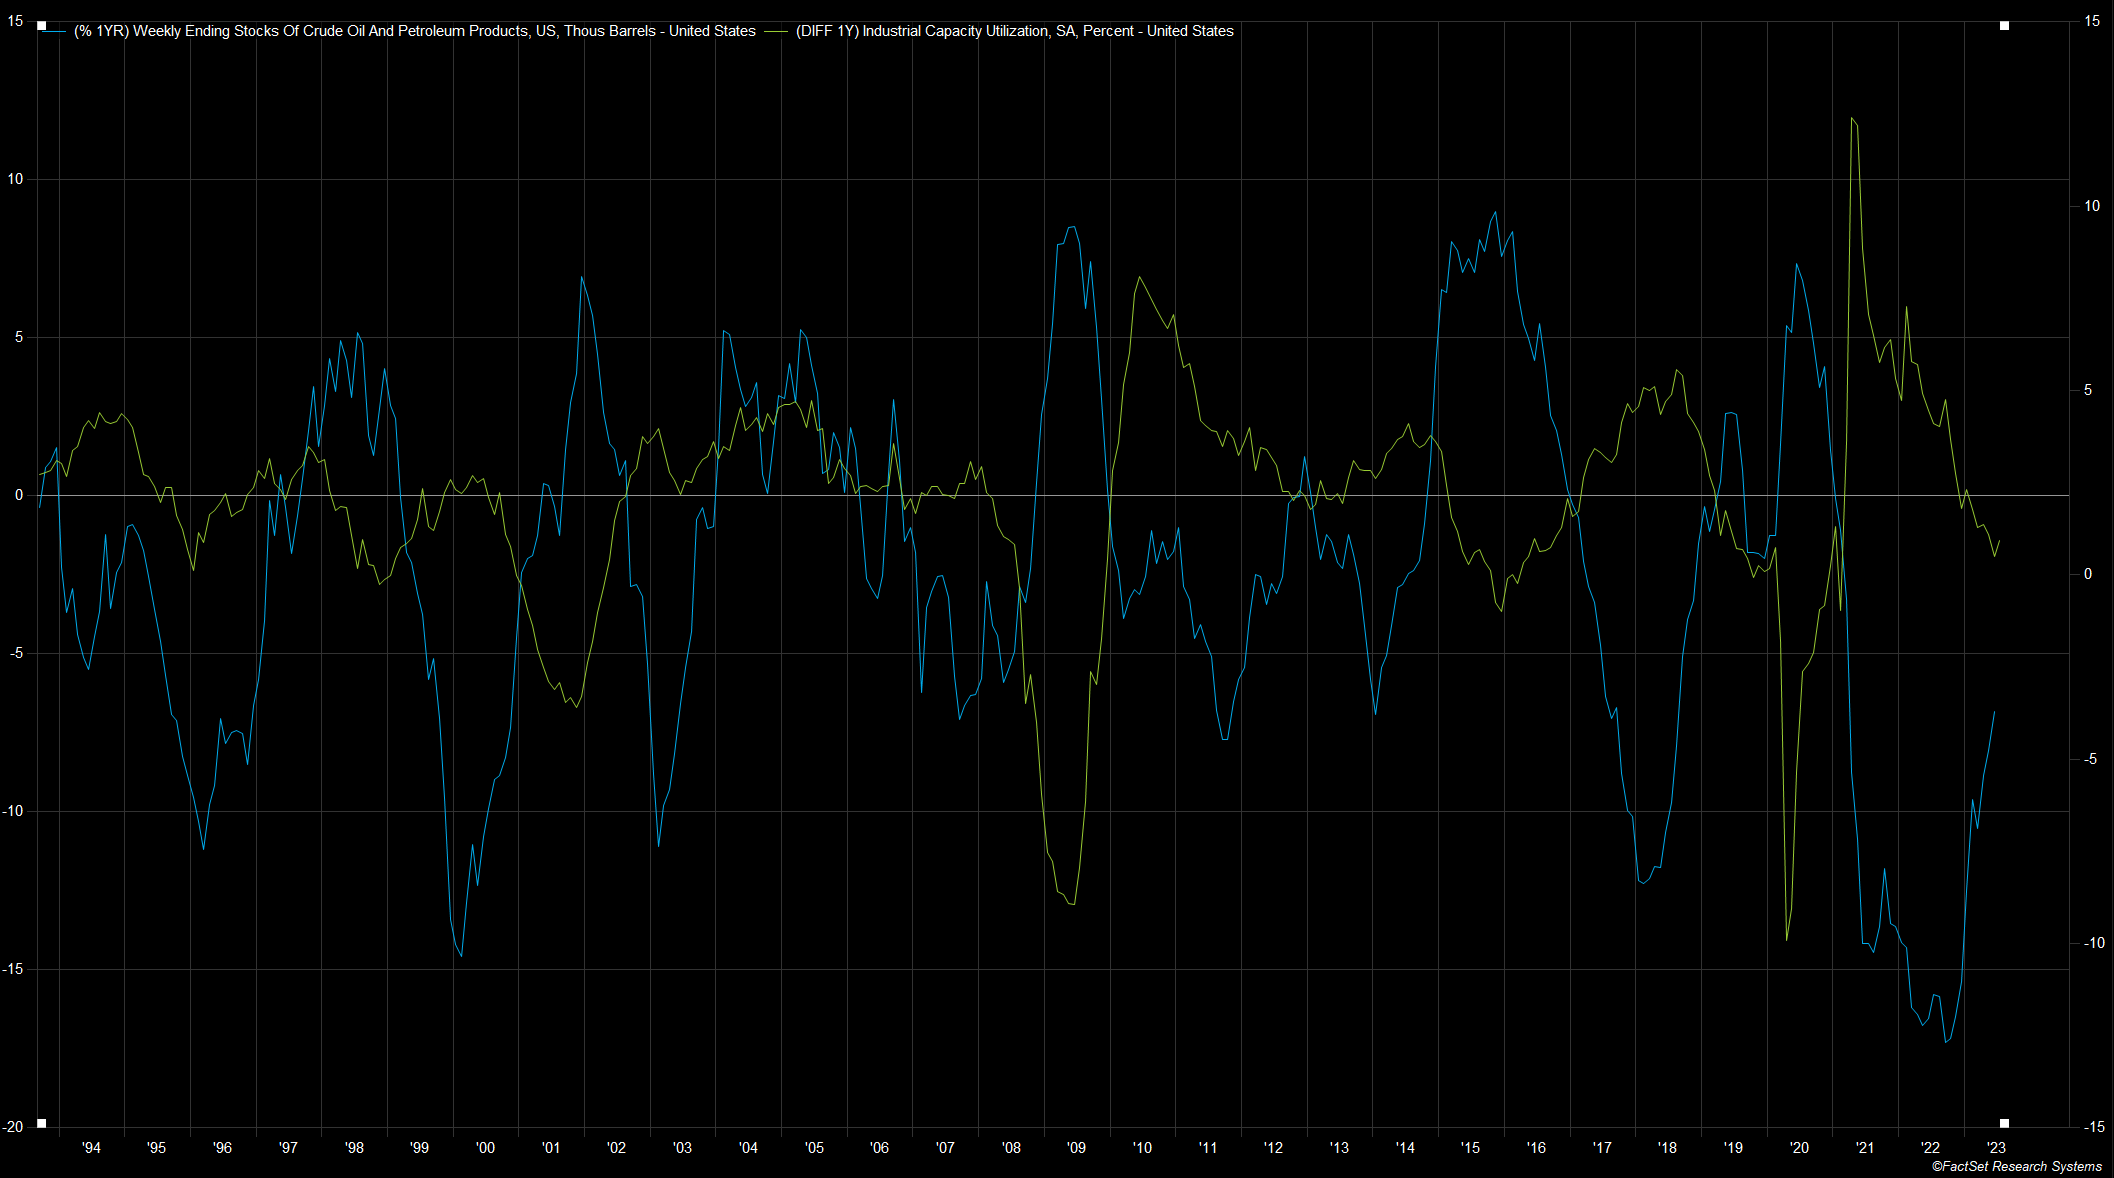
USA - oil stocks vs industrial capacity
Energy is the basis for economic expansion or dynamism. Using weekly crude oil inventories can be a good indicator of certain economic time series, such as industrial capacity utilization. The USO etf and its momentum provide a lot of information to describe the current direction of capacity utilization, and so it only makes sense to look at ending crude oil inventories. The relationship below is clearly negative, meaning that higher inventories correspond to low capacity utilization. Right now, capacity utilization is declining, but at a non-recessionary rate. The same is true for oil inventories. The series is increasing in annual rates of change, but starting from a very low level. As long as we do not see a massive increase in inventories, it is likely that industrial capacity utilization will continue to fall, but not to a recessionary extent.
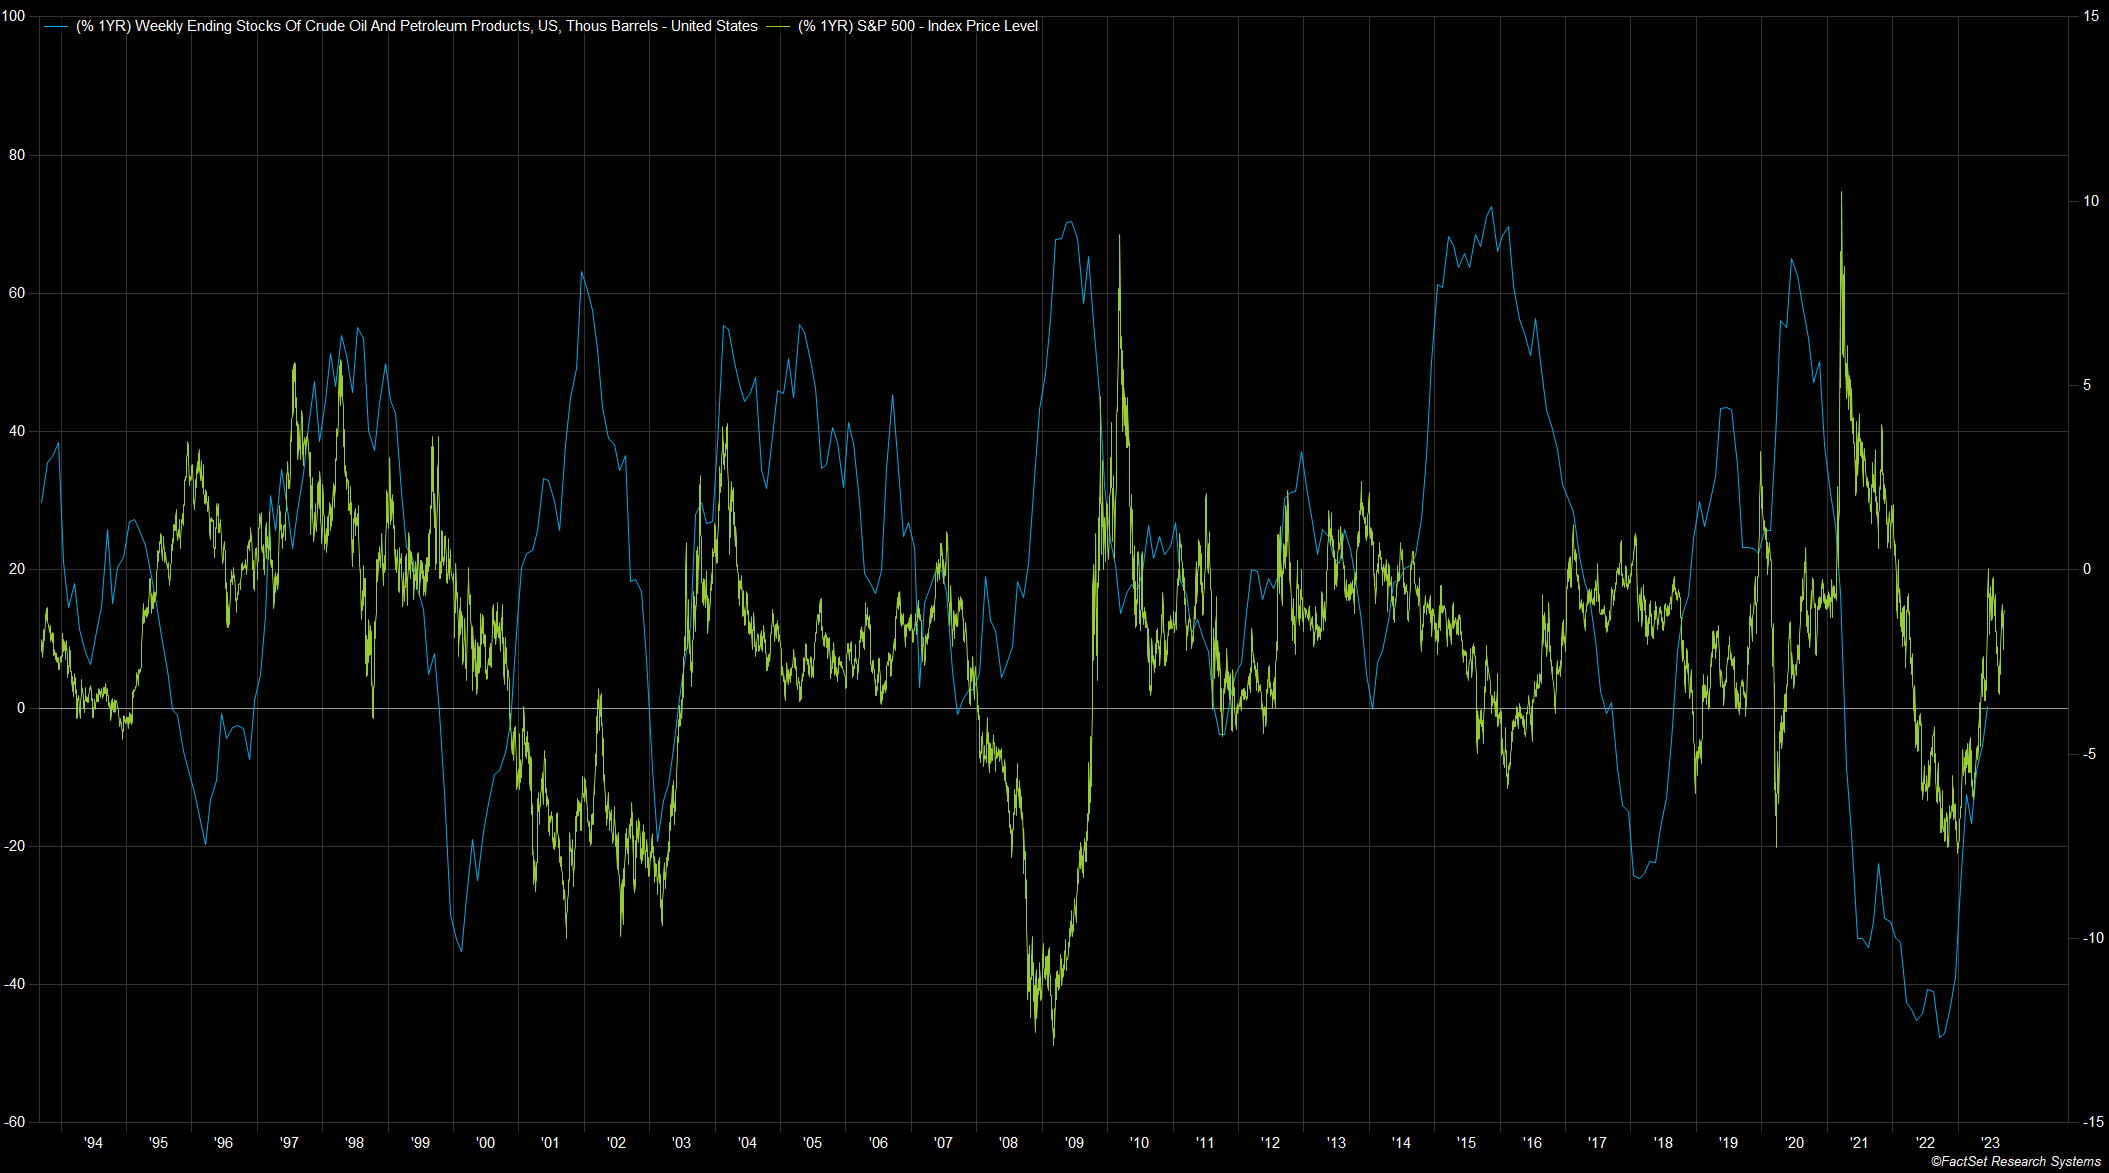
USA - oil stocks vs SP500 returns
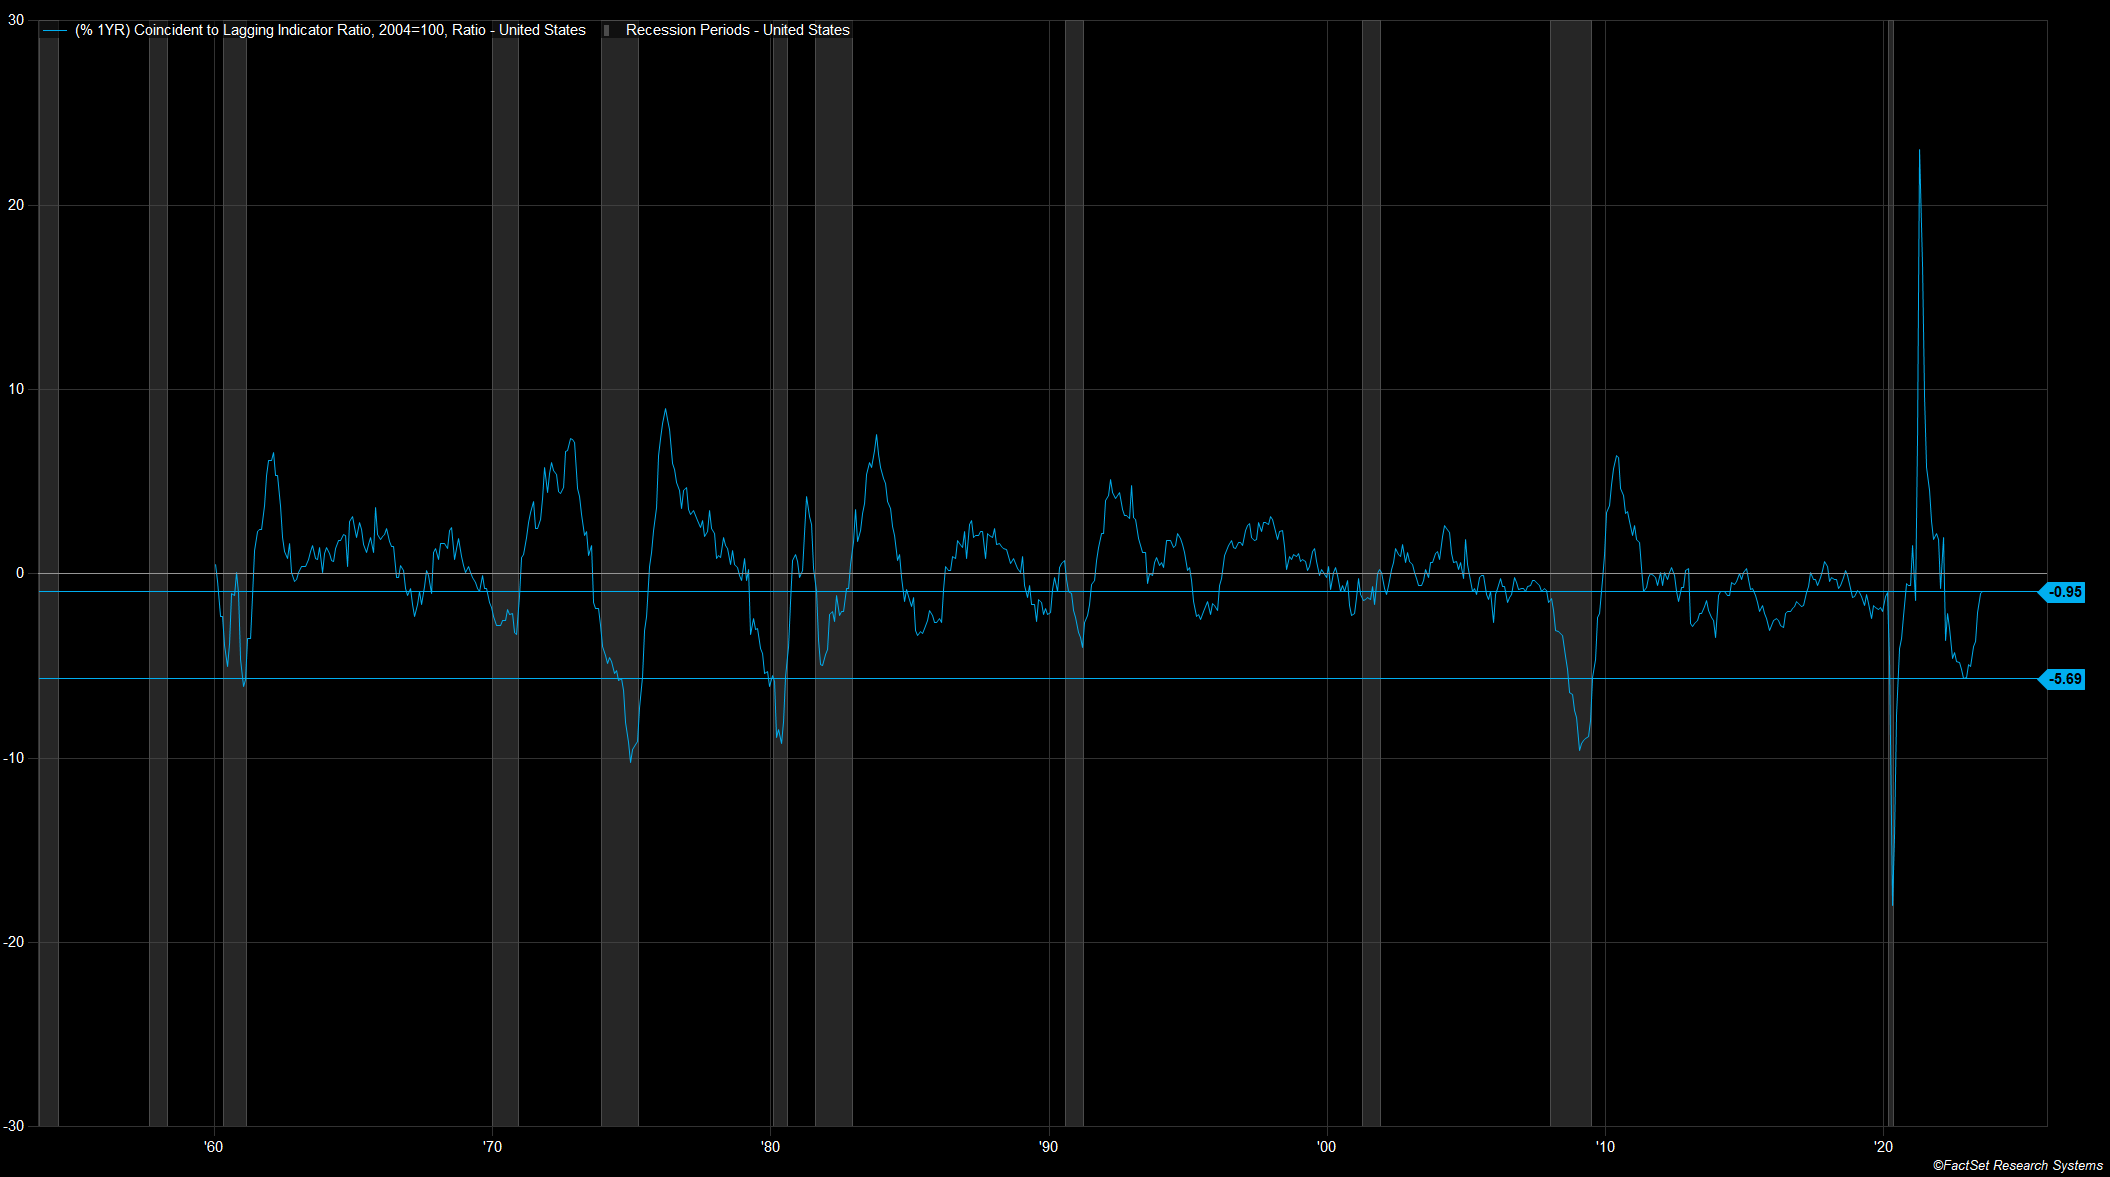
USA - coincident vs lagging
The relationship between coincident indicators and lagging indicators is a good tool for assessing turnarounds. In the figure below, you can see the recession bars, the indicator, the current value, and the "usual" recession value. Using these indicators, we saw a technical recession in 2022 and then an upturn in the underlying data.
USA - margin debt vs SP500
Margin debt is significant in that it raises the overall level or price of an asset by increasing a buyer's purchasing power by an amount x as a factor of his wealth. The relationship between the rate of change in margin debt and the returns of the S&P500 is very strong (first image). In a historical context, the expansion of margin debt has boosted some of the best markets and pre-crisis environments. When margin debt expands too much and exceeds the value of the underlying asset, it is usually a sign of a depressed market. Currently, this is not the case. Margin debt is increasing, but the first derivative is well below the point where a meltdown due to over-indebtedness occurs.
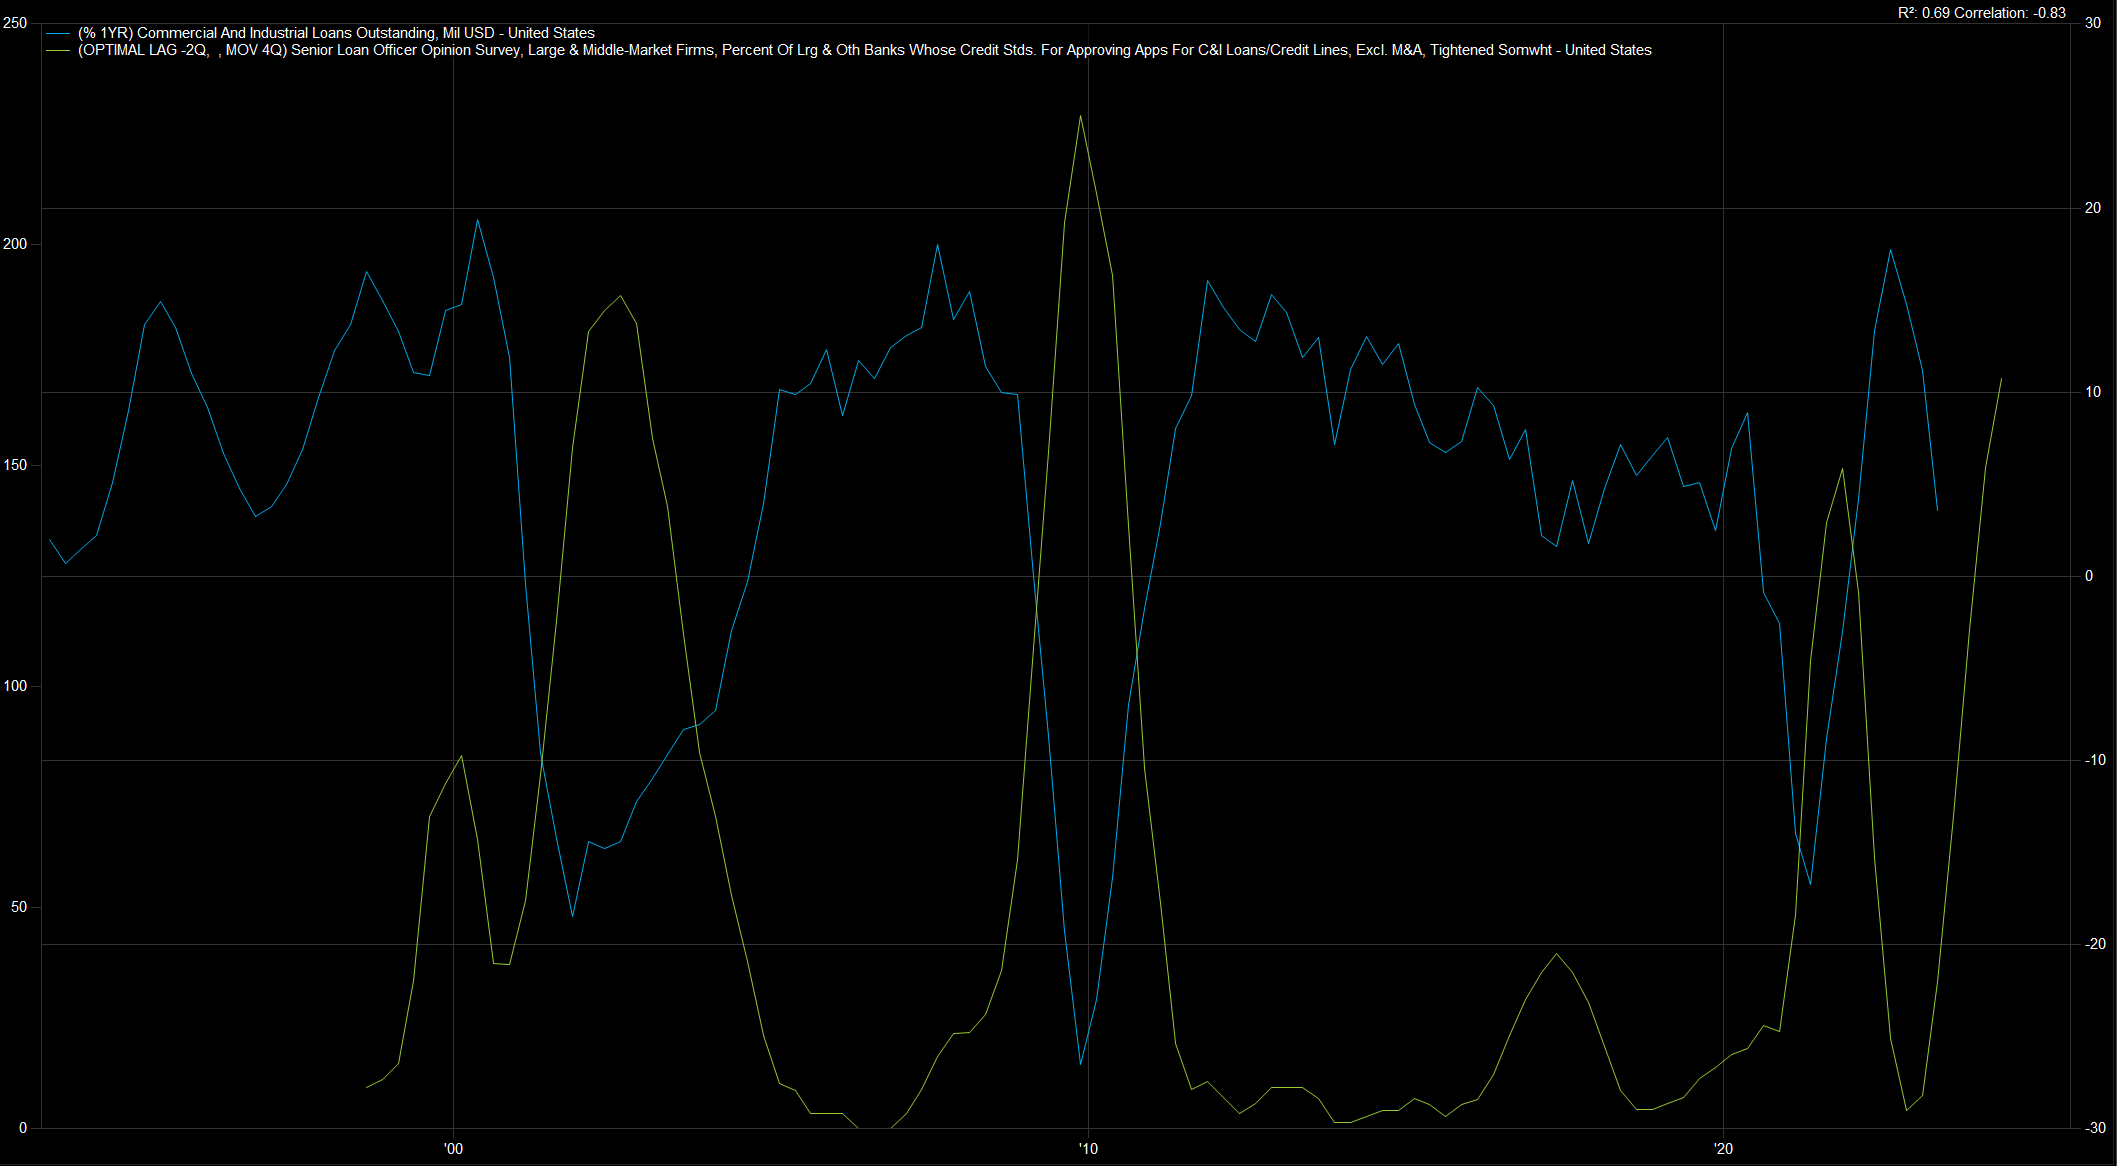
USA - Loans outstanding vs SLOOS
A relationship close to perfect correlation between commercial and industrial loans outstanding and SLOOS data series. SLOOS is defined as the moving sum of the past year and 2 quarters ahead. So this means that the relationship is forward looking and should give us an outlook for the months ahead. Nevertheless, a clear picture emerges, as the SLOOS data show a massive tightening of lending standards similar to 2002. In contrast, a large spending deficit can offset the ongoing tightening, as it acts as a similar structure at the top level of financing. If there is now a sharp decline in deficit spending, the restrictive lending standards will have a massive impact on the future economic expansion path.
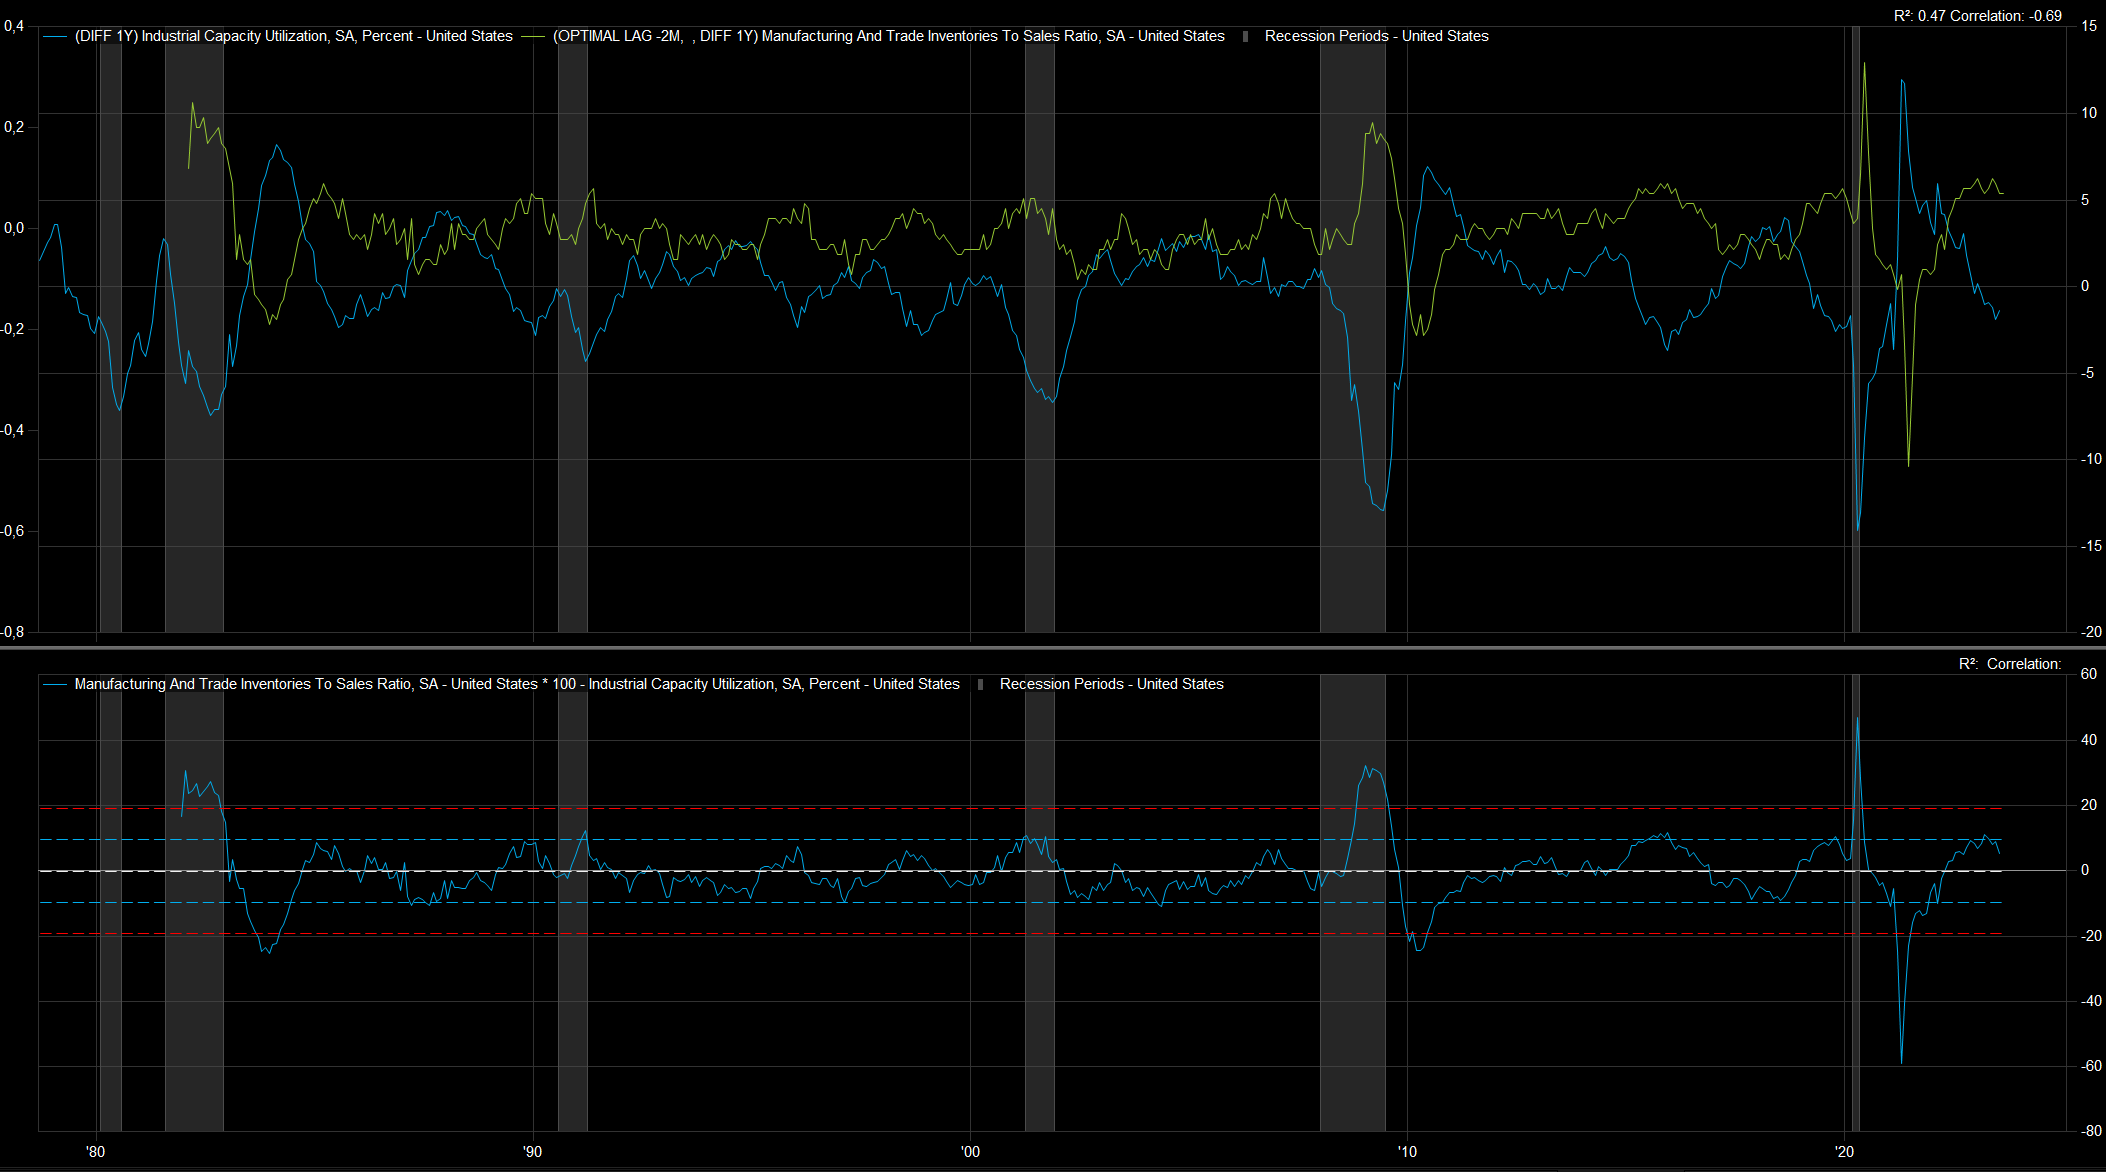
USA - supply side
Again, the relationship between inventories, defined here as the ratio of inventory to sales, shows a non-expansionary result. The index (left y-axis) is positive, which generally leads to lower capacity utilization and thus, in a feedback loop, to lower overall demand. Based on historical assumptions, the indicator is at a standard deviation of +1, and based on this relationship, we would still define the current state of the economy as non-expansionary. Given that we still see many divergent data points, it is likely that the overall complexity of the current state of the economy is very high. The supply-side feedback system would interpret that we need either further fiscal stimulus in the form of deficit spending or credit expansion to bring about a decline in inventories and an increase in utilization rates. Both cases would lead to a general expansion of the money supply and should, in theory, increase aggregate demand.
Yearly coupon:
monthly coupon:
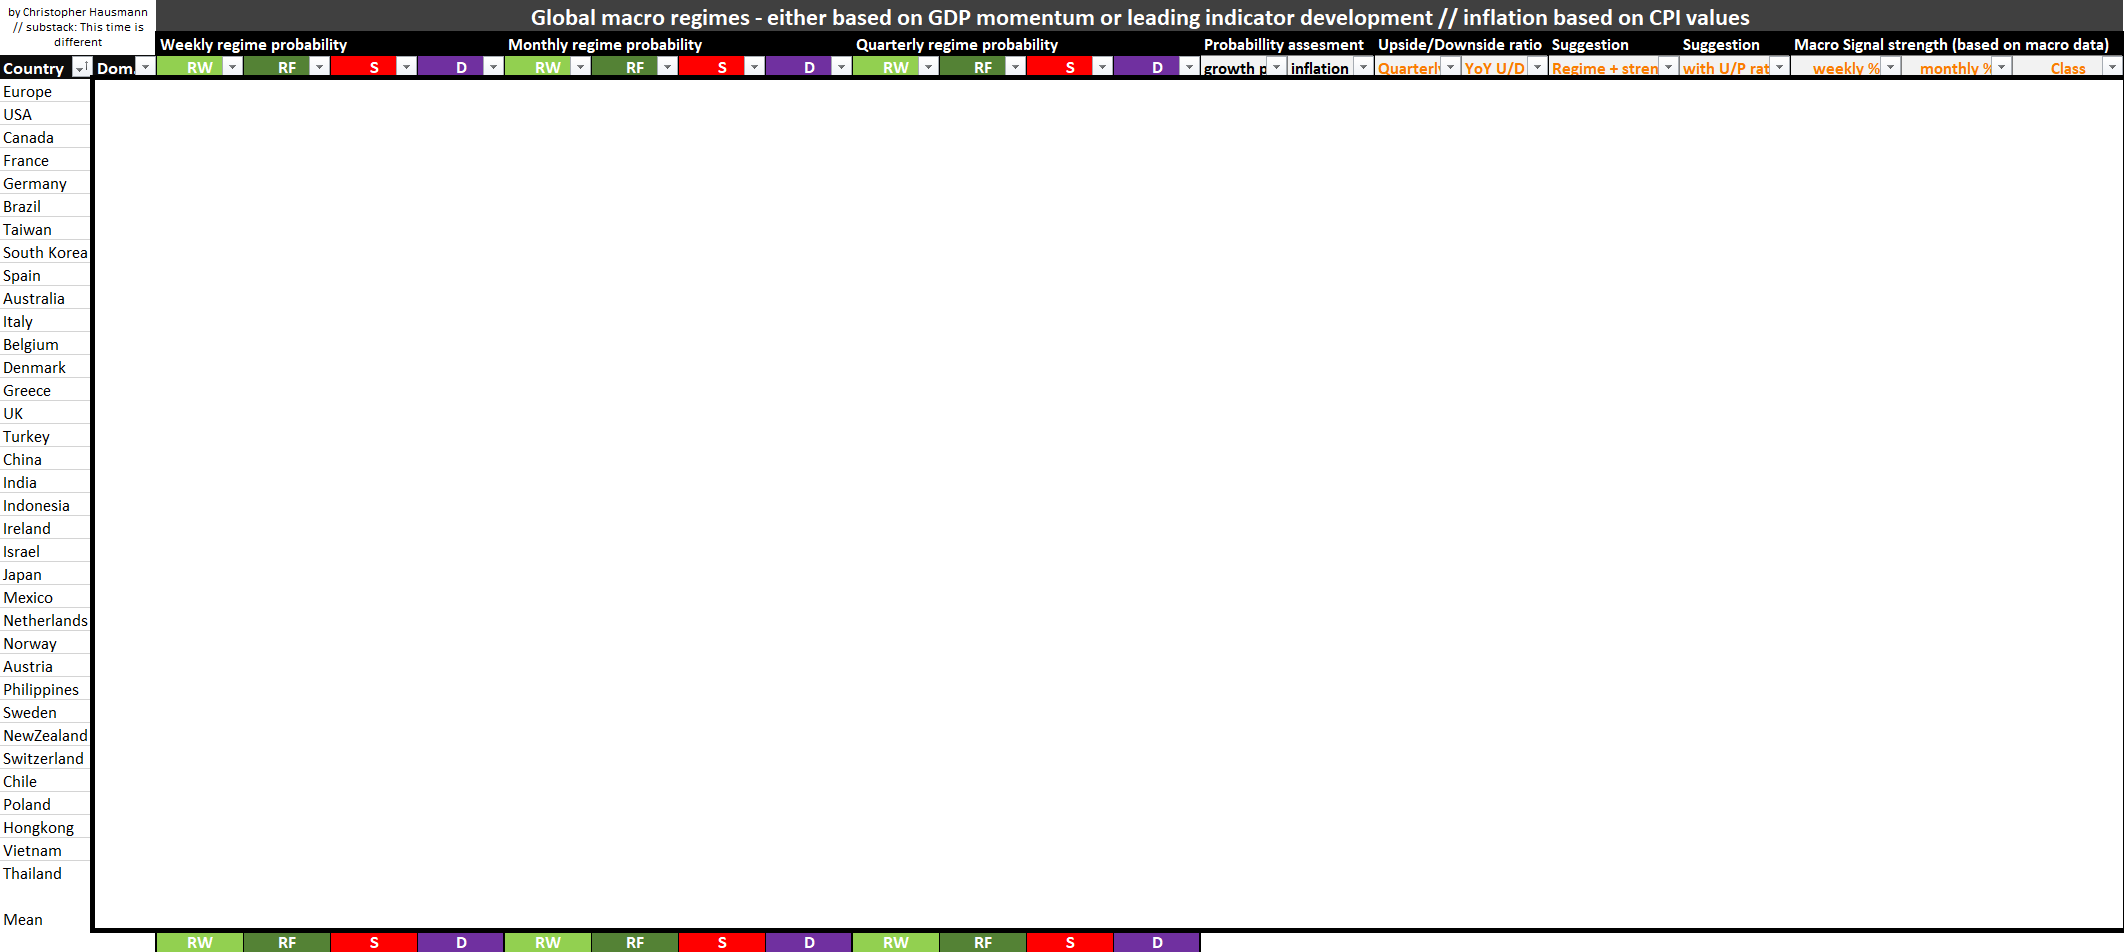
Below you can see the template, which represents the overview of the 30+ countries and is an essential part of the weekly analysis.
Global macro overview:
Keep reading with a 7-day free trial
Subscribe to This Time is Different to keep reading this post and get 7 days of free access to the full post archives.