This Content is intended for educational purposes only. No portion of this Content purports to be, individualized or specific investment advice and is not created to provide investment advice to individuals. All information provided is impersonal, general in nature and is made without regard to individual levels of sophistication or investment experience, investment preferences, objectives or risk parameters and without regard to the suitability of the Content for individuals or entities who may access it. No information found on this Newsletter, nor any Services provided, should be construed as an offer to sell, or a solicitation of an offer to buy any security or investment vehicle, nor should it be construed as tailored or specific to you, or any reader or consumer thereof. You understand and agree that this Content does not constitute specific recommendations of any particular investment, security, portfolio, transaction or strategy, nor does it recommend any specific course of action is suitable for any specific person or entity or group of persons or entities
An introduction
Each Nowcast is composed of several different factors that are closely related to the GDP or CPI time series.
For reference - the Nowcast is essential for determining the market regime, were we refer to a regime matrix, which is defined by growth and inflation. This method is widely accepted and provides good statistics for return and risk. Respectable companies such as Bridgewater, Gavekal and Hedgeye, as well as well-known investors use this type of categorization.
Regimes:
RW (real growth, growth rising - inflation falling)
RF (reflation, growth rising - inflation rising)
S (stagflation, growth falling - inflation rising)
D (disinflation, growth falling - inflation falling)
In order for the process to be as accurate as possible and have the lowest possible error rates, two different methods are used. On the one hand the Dynamic Factor Method and on the other hand a Bayesian Framework Analysis. The quarterly values of the GDP data is adjusted as well as interpolated to function as a monthly statistic.
Let’s dig into the numbers, shall we?
Spotlight: Germany
This week, the focus is on Germany, because it is the most important country in the EU. Everyone is aware of the energy situation in Germany and all over Europe. Remember the relationship between energy consumption and GDP is >0.8 (correlation), and for electricity consumption it is also well above 0.7. Less energy means less GDP, it is as simple as that.
If we look at the regime now forecast, it is a clear disinflation regime for Germany given the monthly macroeconomic data. GDP declines at the same rate in both model outcomes, and the consumer price index declines dramatically in the first data analysis in 2023.
Based on the Bayesian simulation, the variance for the GDP nowcast is quite large with lower GDP growth of -4.74 yoy.
The nowcast probabilities also currently point to disinflation. What is new is the increase in the real growth probability for Germany, which is quite high given the general situation. We will look at some growth data in the further course of the article.
GDP
Below you can see the GDP nowcast for Germany in a chart with three different models. The aggregate model is the mean of the factor, bayesian and ML model.
A general look at some macro data for Germany
Below are some data points for the growth analysis in Germany. There are two adjustments to the data, namely the YoY growth rate and the first difference from YoY numbers. In the last market call, I was asked what are the different aspects of the macro signal strength model (market-implied regimes) and the nowcast regimes.
The main difference is that for the nowcast model I use monthly data, which is often backward looking (you can see that only 4 data points are current December values). For the macro signal strength model, I use daily data points that do not have a 1-2 month lookback. Considering that these models are not perfect, with a prediction error of 0, you can see that some models can come to different results. This is the reason why I try to assess the macroeconomic environment from 1 to 3 different angles as well as in a probabilistic way.
What you can see in the data is, that the IFO surveys did show some positive momentum in November/December with +4,49, 2,83 and 4,15. This did increase the real growth probability for Germany.
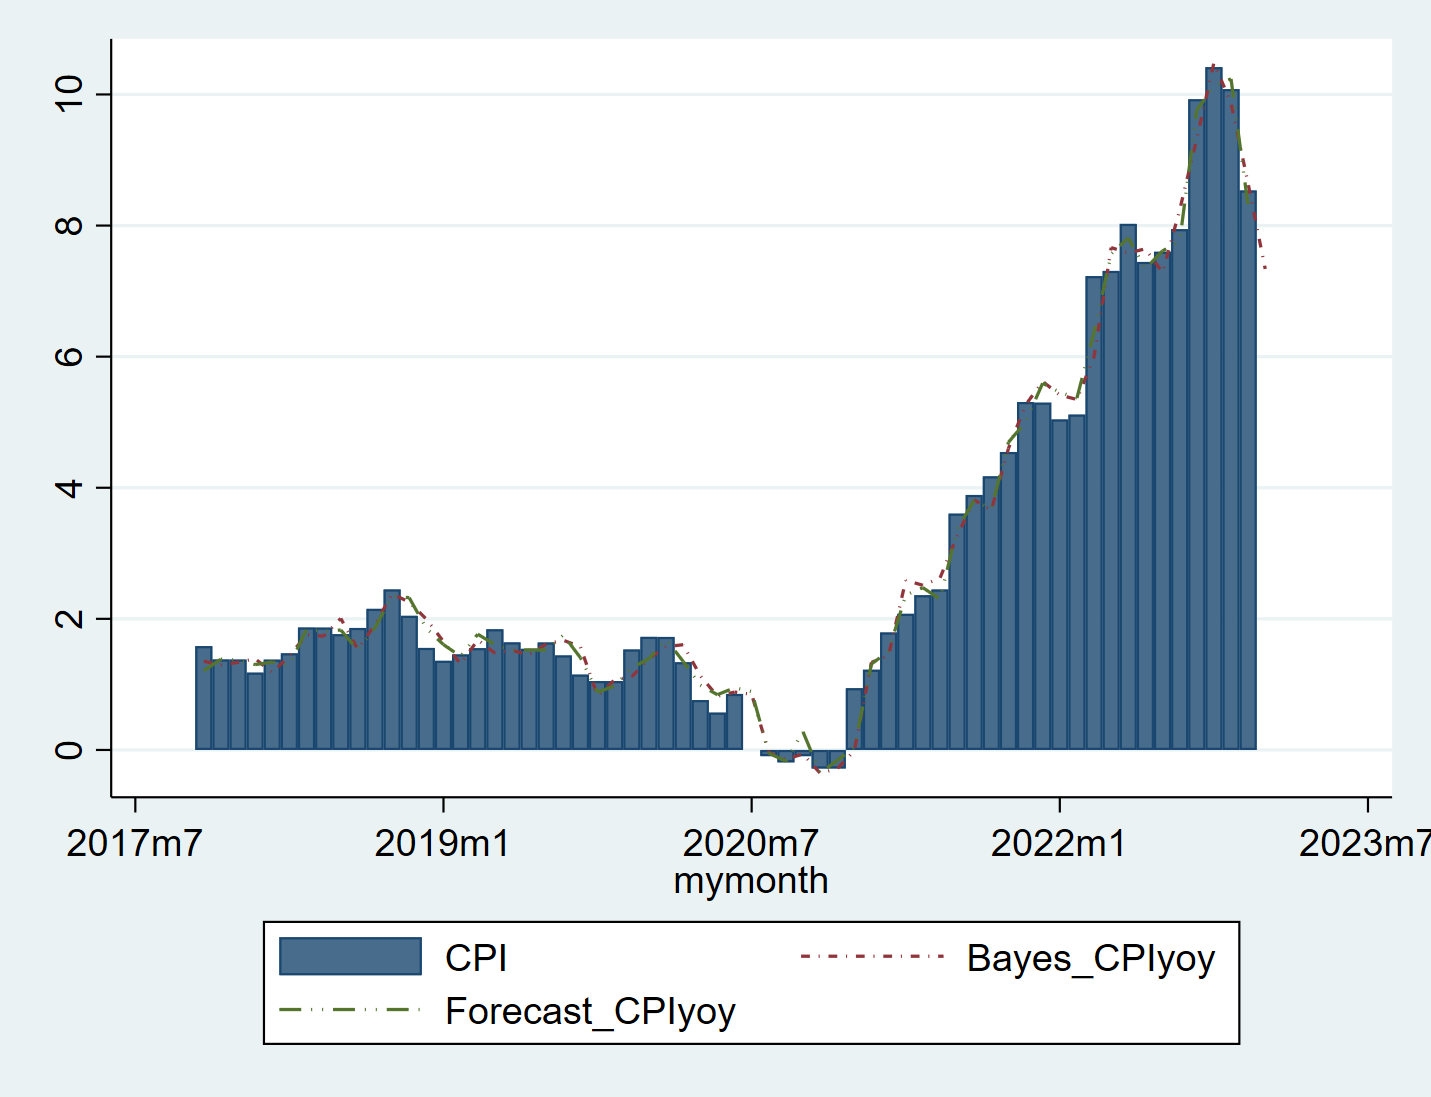
CPI
The latest CPI took at big hit in the last months and is currently set be in the range of 6,80 to 7,86.
Germany stock index
We are still in a low/no growth regime. Unless things change, this is in general not good for equities as the chart below shows. High volatility and low return expectations.
If you would like to access the data for the whole 20 countries get the FREE 7 day trial. I hope that you’ve like the article so far.
Keep reading with a 7-day free trial
Subscribe to This Time is Different to keep reading this post and get 7 days of free access to the full post archives.


