Recognizing the chaos in the markets #2
using mathematical techniques to analyze potential stock market moves

This Content is intended for educational purposes only. No portion of this Content purports to be, individualized or specific investment advice and is not created to provide investment advice to individuals. All information provided is impersonal, general in nature and is made without regard to individual levels of sophistication or investment experience, investment preferences, objectives or risk parameters and without regard to the suitability of the Content for individuals or entities who may access it. No information found on this Newsletter, nor any Services provided, should be construed as an offer to sell, or a solicitation of an offer to buy any security or investment vehicle, nor should it be construed as tailored or specific to you, or any reader or consumer thereof. You understand and agree that this Content does not constitute specific recommendations of any particular investment, security, portfolio, transaction or strategy, nor does it recommend any specific course of action is suitable for any specific person or entity or group of persons or entities
In this series we will explore the chaotic nature of markets and try to evaluate current and historical movements in the context of complex, chaotic and fractal structures. Most of the time we will look at the price movements of the major indices, such as S&P500 or NASDAQ. There will be a free spotlight in each post.
What will we be looking at?
Measures like entropy, Hurst exponents, etc.
Nonlinear correlation measures like transfer entropy, distance correlation, etc.
Each measure is dynamically computed to express near-time information
Implicit momentum based on the outcome measure (machine learning).
Measures such as XLU/IWM spread in the context of non-linear correlation and ratio momentum.
Below you can find a short description of the measures involved in the analysis
Important features:
Lyapunov exponent: The Lyapunov exponent is a mathematical concept used in chaos theory to measure the rate of divergence of two initially close trajectories in a dynamical system. In other words, it is a measure of how sensitive a system is to its initial conditions. A positive Lyapunov exponent indicates that nearby trajectories in phase space diverge exponentially, while a negative exponent indicates that they converge.
Hurst exponent: The Hurst exponent is a measure of the degree of persistence or anti-persistence in a time series, where persistence refers to the tendency of a system to remain in a state for a long time, while anti-persistence refers to the tendency to switch rapidly between states. A Hurst exponent of 0.5 indicates a random walk or a system with no long-term memory, while values greater than 0.5 indicate persistent behavior and values less than 0.5 indicate anti-persistent behavior.
Shannon entropy: is a measure of the amount of uncertainty or information content in a system. Higher entropy in financial data can indicate a higher level of uncertainty or risk.
Mutual information: Mutual information measures the amount of information that two variables share. It is based on the idea of entropy and measures the reduction in uncertainty of one variable given knowledge of the other. A higher mutual information indicates a stronger relationship between the variables.
Distance correlation: Distance correlation is a measure of the dependence between two variables that does not rely on linear relationships. It is based on the idea of covariance and is calculated by comparing the distance matrices of the variables. A higher distance correlation indicates a stronger dependence between the variables.
Transfer entropy: Transfer entropy measures the amount of information that one time series provides about another time series. It is based on the idea of causality and measures the reduction in uncertainty of the future state of one time series given knowledge of the other. A higher transfer entropy indicates a stronger causal relationship between the time series.
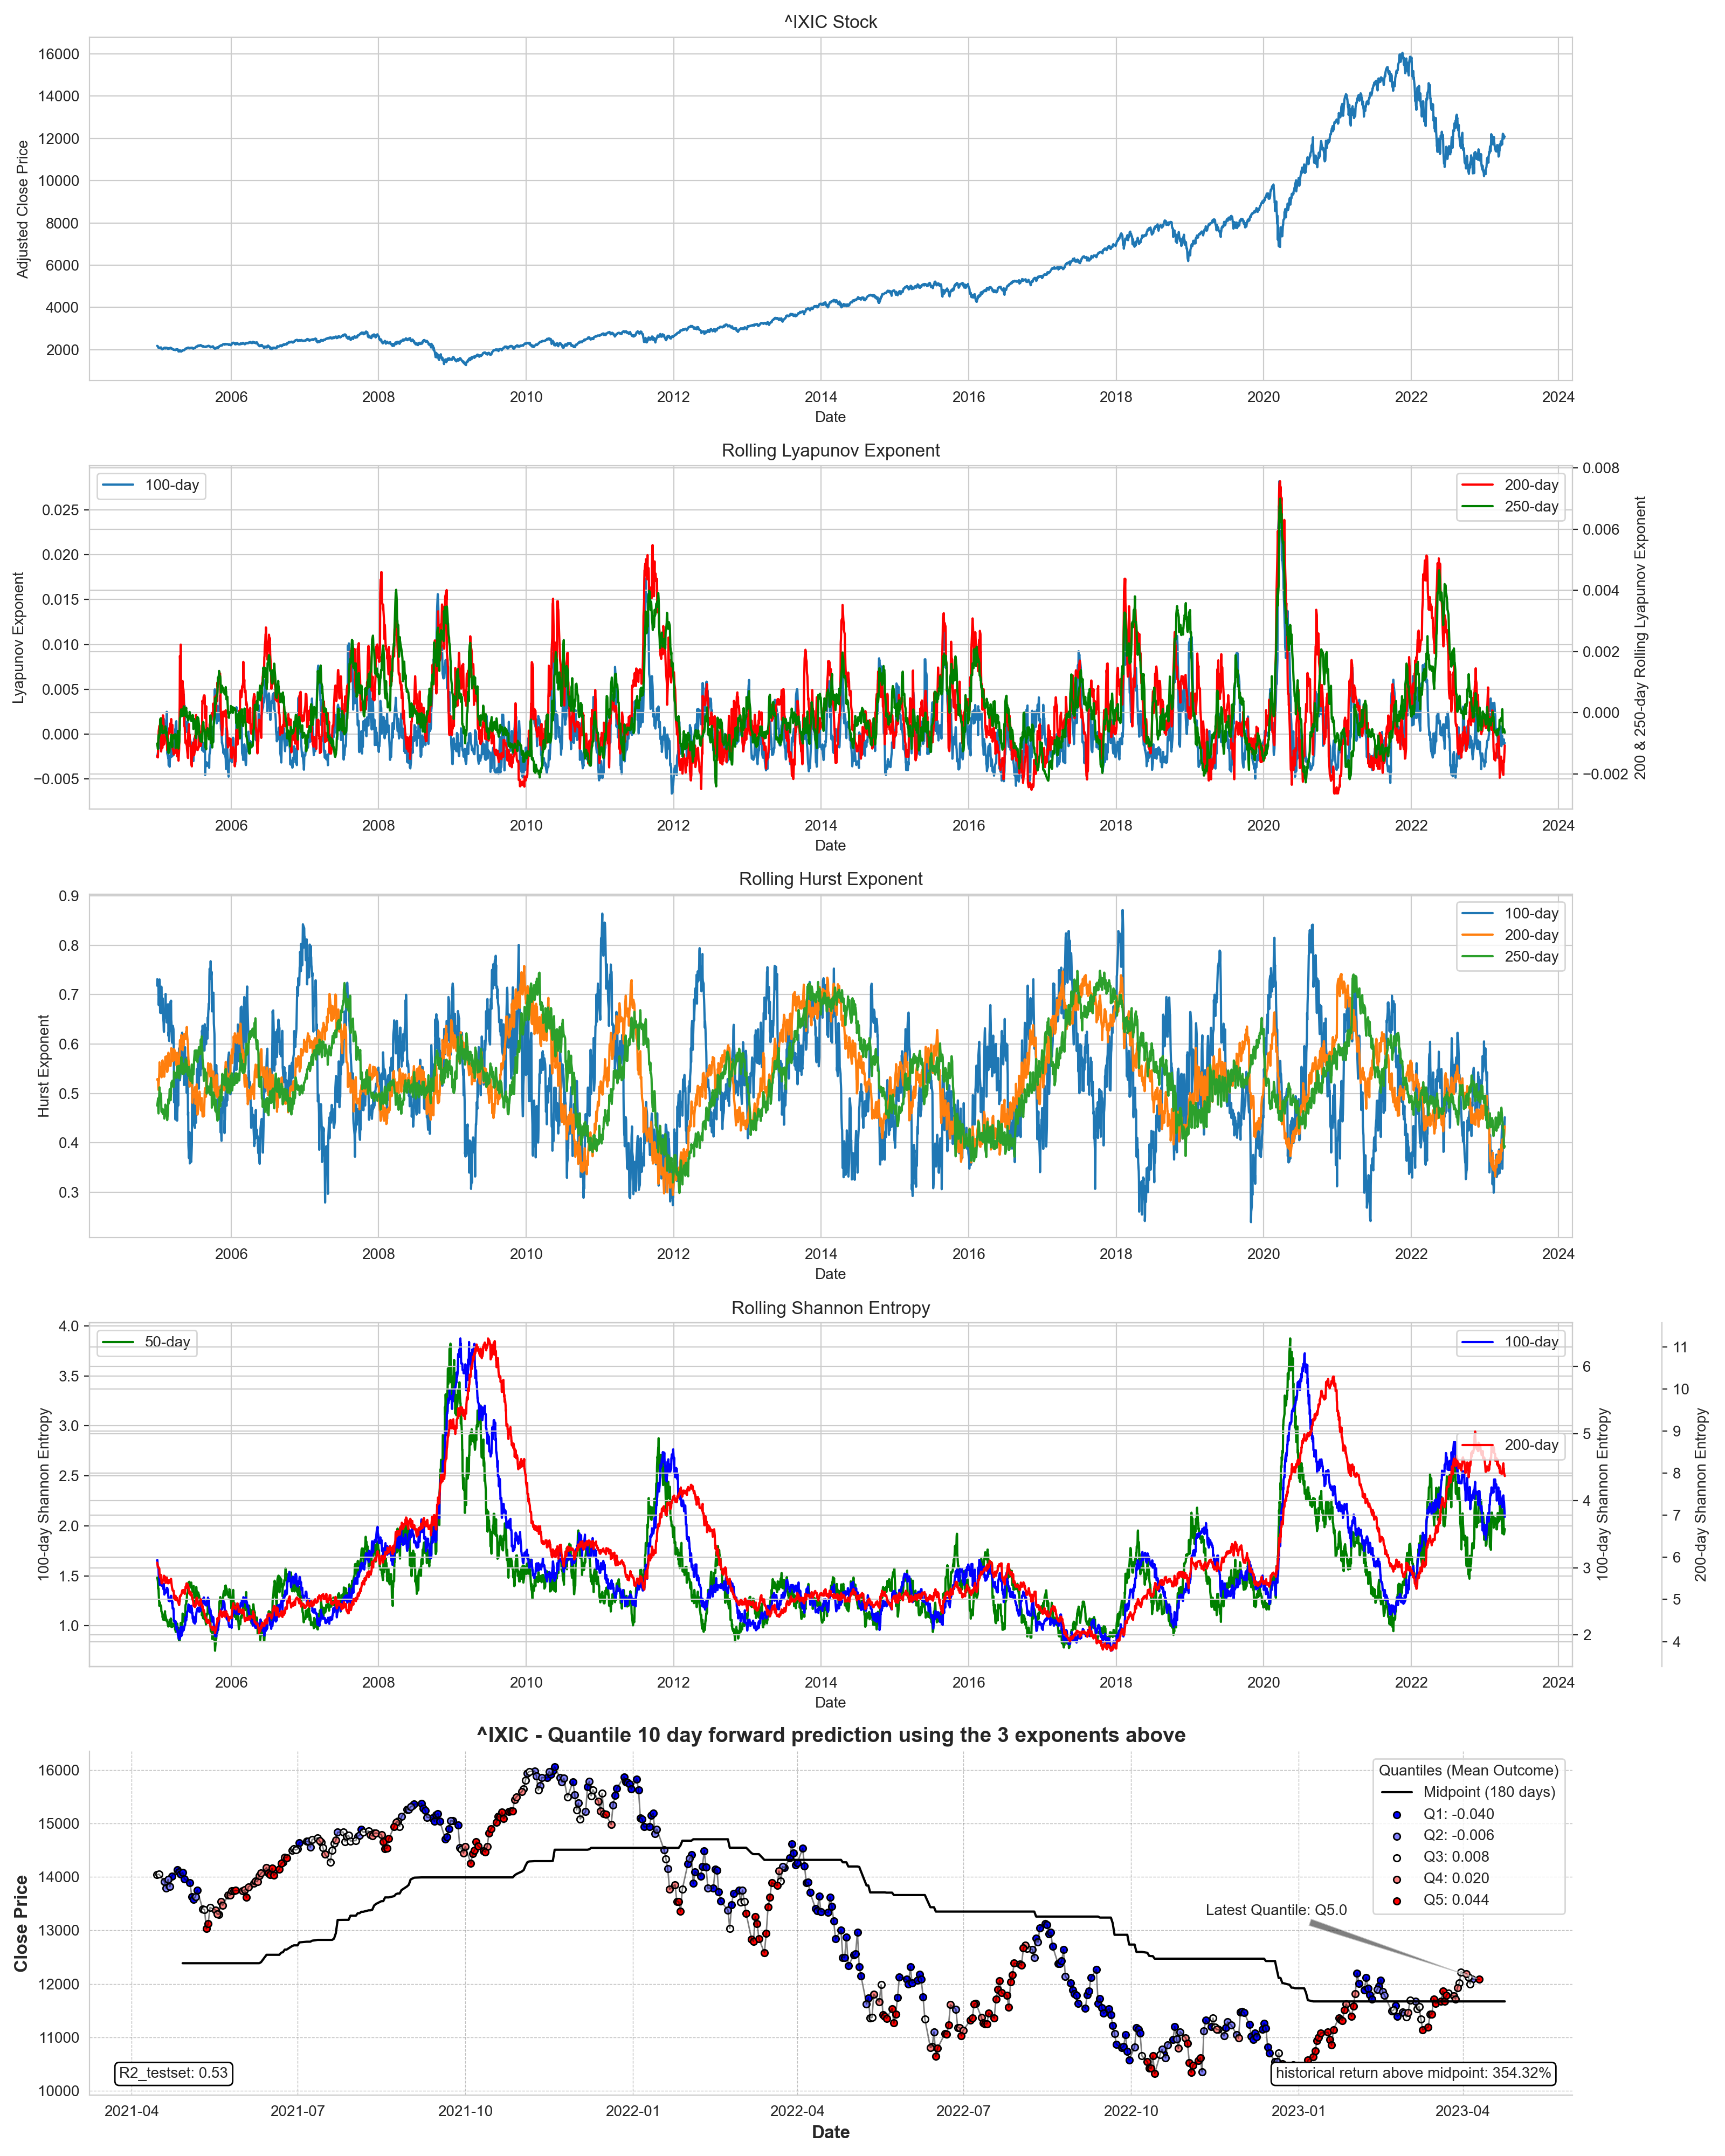
NASDAQ analysis
The Lyapunov exponents are currently in a stable range, which means that volatility should be low/medium in the near future. The rolling Lyapunov exponents indicate neither upward nor downward exponential movement. The Hurst exponents show anti-persistence across all rolling windows, so price and yield may zigzag in the near term. Entropy measures are still elevated relative to historical levels, so we are still in a period of quite unpredictable movements. A current positive sign is the decline in the rolling entropy measure, but it is still in the range of 2018/2019 values. The momentum channel is currently set to an optimal window of 180 days (optimization for maximum return with minimum channel crossover). Given the recent price action, we see a bullish breakout, which is quite strong given the current data, as the last quantile is 5. This means that the expected 10-day mean forward return is 0.044 or 4.4%. Each red dot in the last subgraph reflects the 5th quantile (for a historical perspective).
Some other updates:
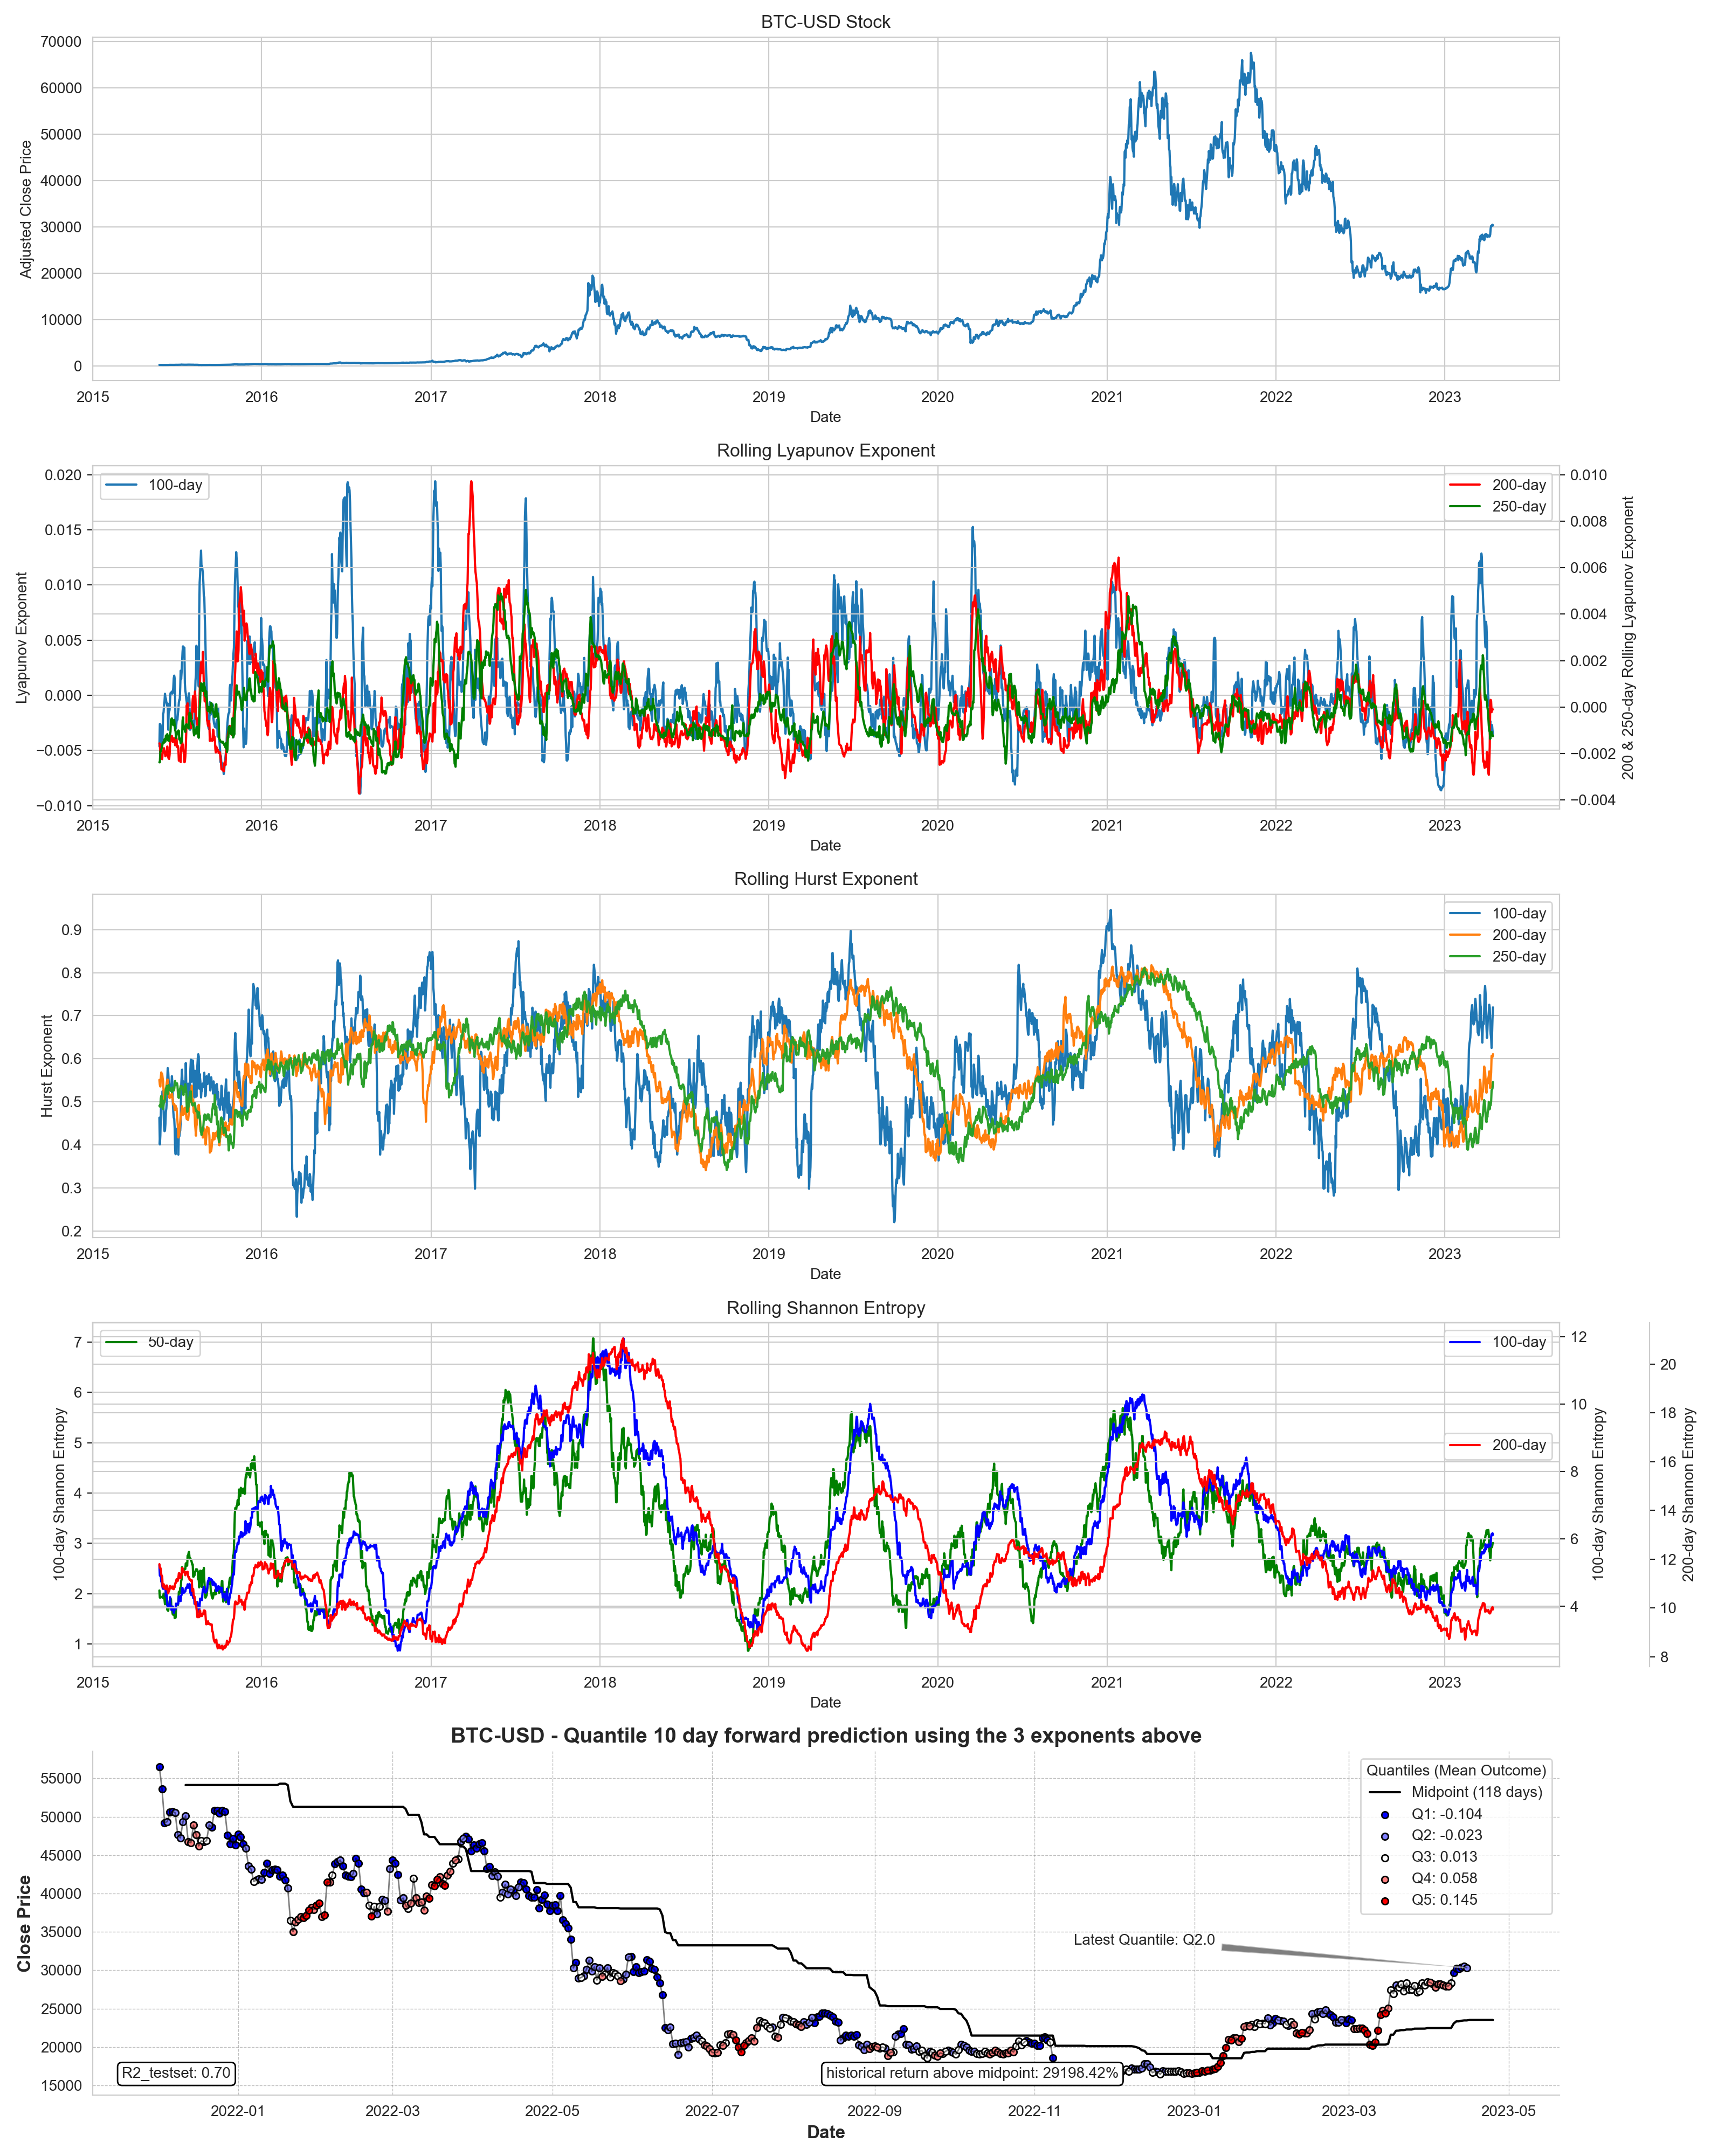
BTC-USD
Current upward movement as we are above the optimized momentum channel.
The 100-day hurst is showing consistency, and the 200- and 250-day hursts are rising
Entropy measures are rising slightly in the 50- and 100-day measures, which could indicate a short correction.
The 10-day forward yield is in quantile 2, where we should expect a future return of -2.3%.
Be careful: in the last 5 entries we have the signal of several quantile 1 prints, which has an expected 10 day forward return of -10.3%
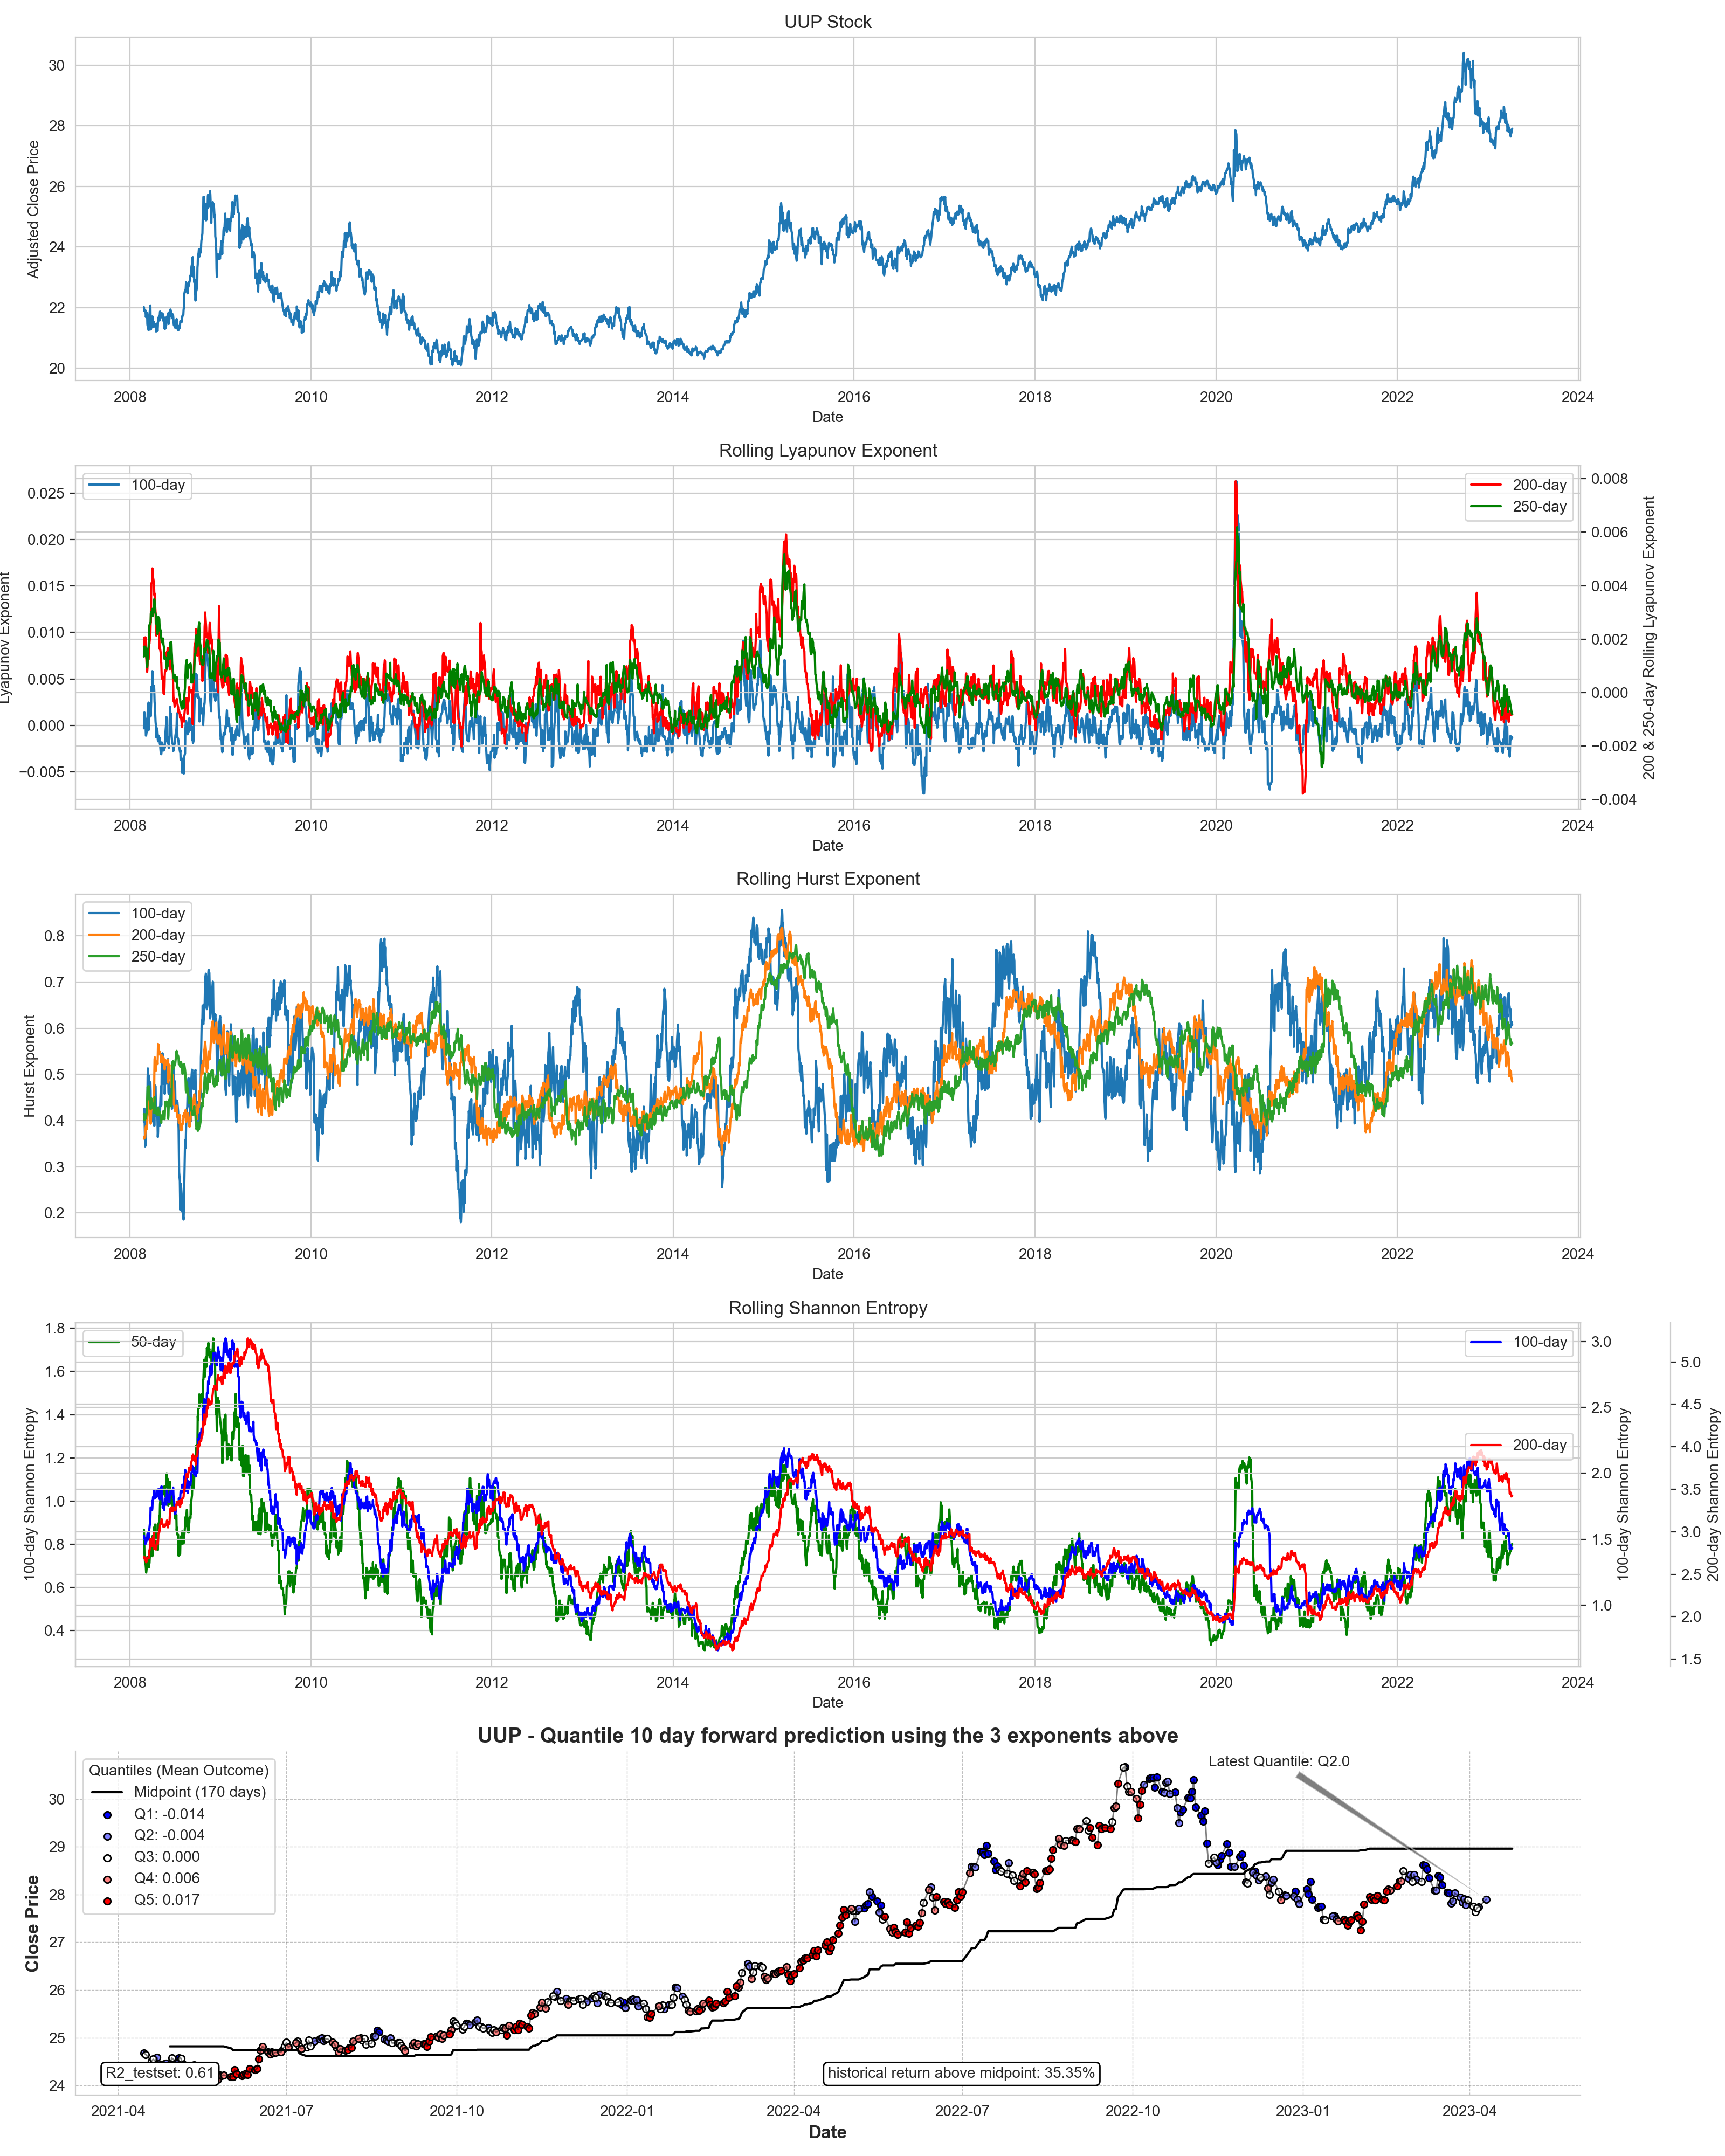
UUP
current bearish price movement, because we are above the optimized momentum channel
200d & 250d hursts are falling
entropy measures are falling in the 50 day and 100 day measures, which signals a more predictive bearish move in the near term
10 day forward return are in quantile 2, were we should a expect a future return of -0,4%.
Yearly coupon:
monthly coupon:
If you like this kind of information feel free to share the article. Behind the paywall are more model in a PDF form for currently another 20 ETFs and indexes.
Keep reading with a 7-day free trial
Subscribe to This Time is Different to keep reading this post and get 7 days of free access to the full post archives.