This Content is intended for educational purposes only. No portion of this Content purports to be, individualized or specific investment advice and is not created to provide investment advice to individuals. All information provided is impersonal, general in nature and is made without regard to individual levels of sophistication or investment experience, investment preferences, objectives or risk parameters and without regard to the suitability of the Content for individuals or entities who may access it. No information found on this Newsletter, nor any Services provided, should be construed as an offer to sell, or a solicitation of an offer to buy any security or investment vehicle, nor should it be construed as tailored or specific to you, or any reader or consumer thereof. You understand and agree that this Content does not constitute specific recommendations of any particular investment, security, portfolio, transaction or strategy, nor does it recommend any specific course of action is suitable for any specific person or entity or group of persons or entities.
This is a new weekly series where you will get a number of indices and ETFs analyzed using the "Recognizing Market Chaos" framework. I will highlight the best opportunities based on the overviews and include the image in the blog post. This is the first post for the new theme, so I need a little more time to adjust the content and find the right way to deliver the most value.
For an introduction, see the posts on recognizing chaos in the market.
Recognizing the chaos in the markets #2

This Content is intended for educational purposes only. No portion of this Content purports to be, individualized or specific investment advice and is not created to provide investment advice to individuals. All information provided is impersonal, general in nature and is made without regard to individual levels of sophistication or investment experience, investment preferences, objectives or risk parameters and without regard to the suitability of the Content for individuals or entities who may access it. No information found on this Newsletter, nor any Services provided, should be construed as an offer to sell, or a solicitation of an offer to buy any security or investment vehicle, nor should it be construed as tailored or specific to you, or any reader or consumer thereof. You understand and agree that this Content does not constitute specific recommendations of any particular investment, security, portfolio, transaction or strategy, nor does it recommend any specific course of action is suitable for any specific person or entity or group of persons or entities
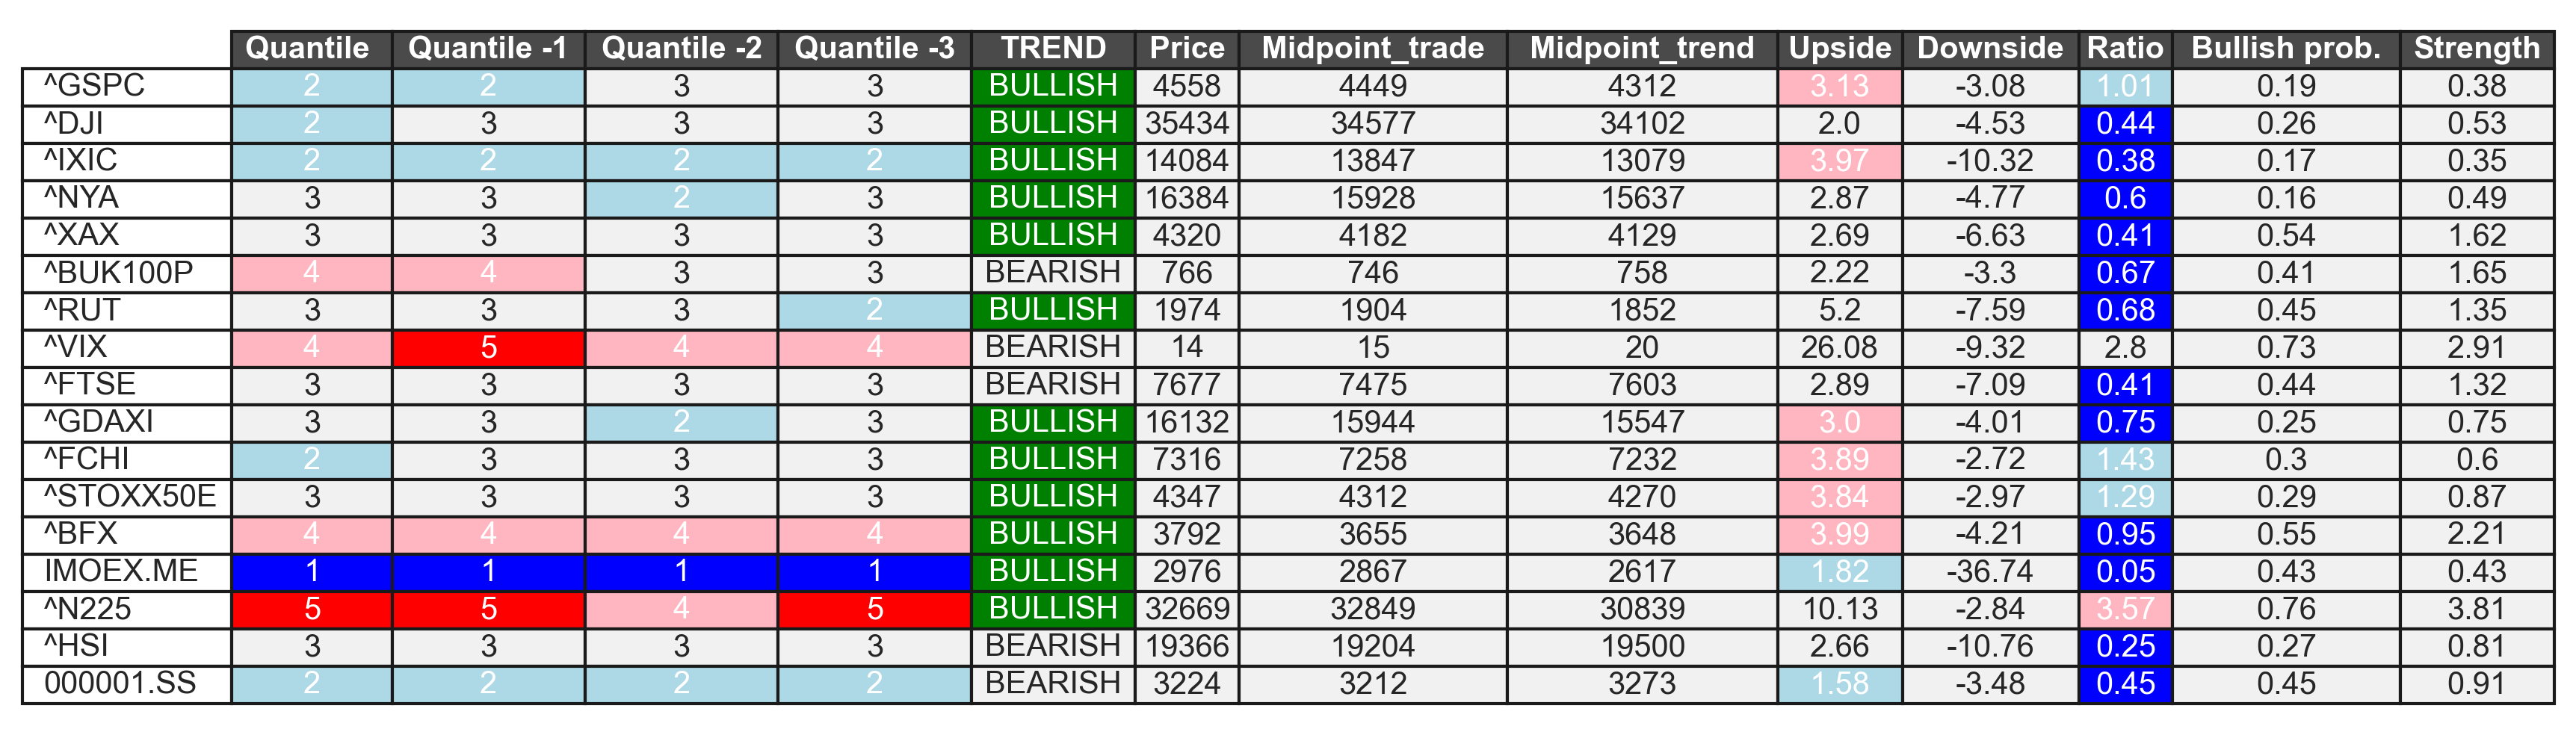
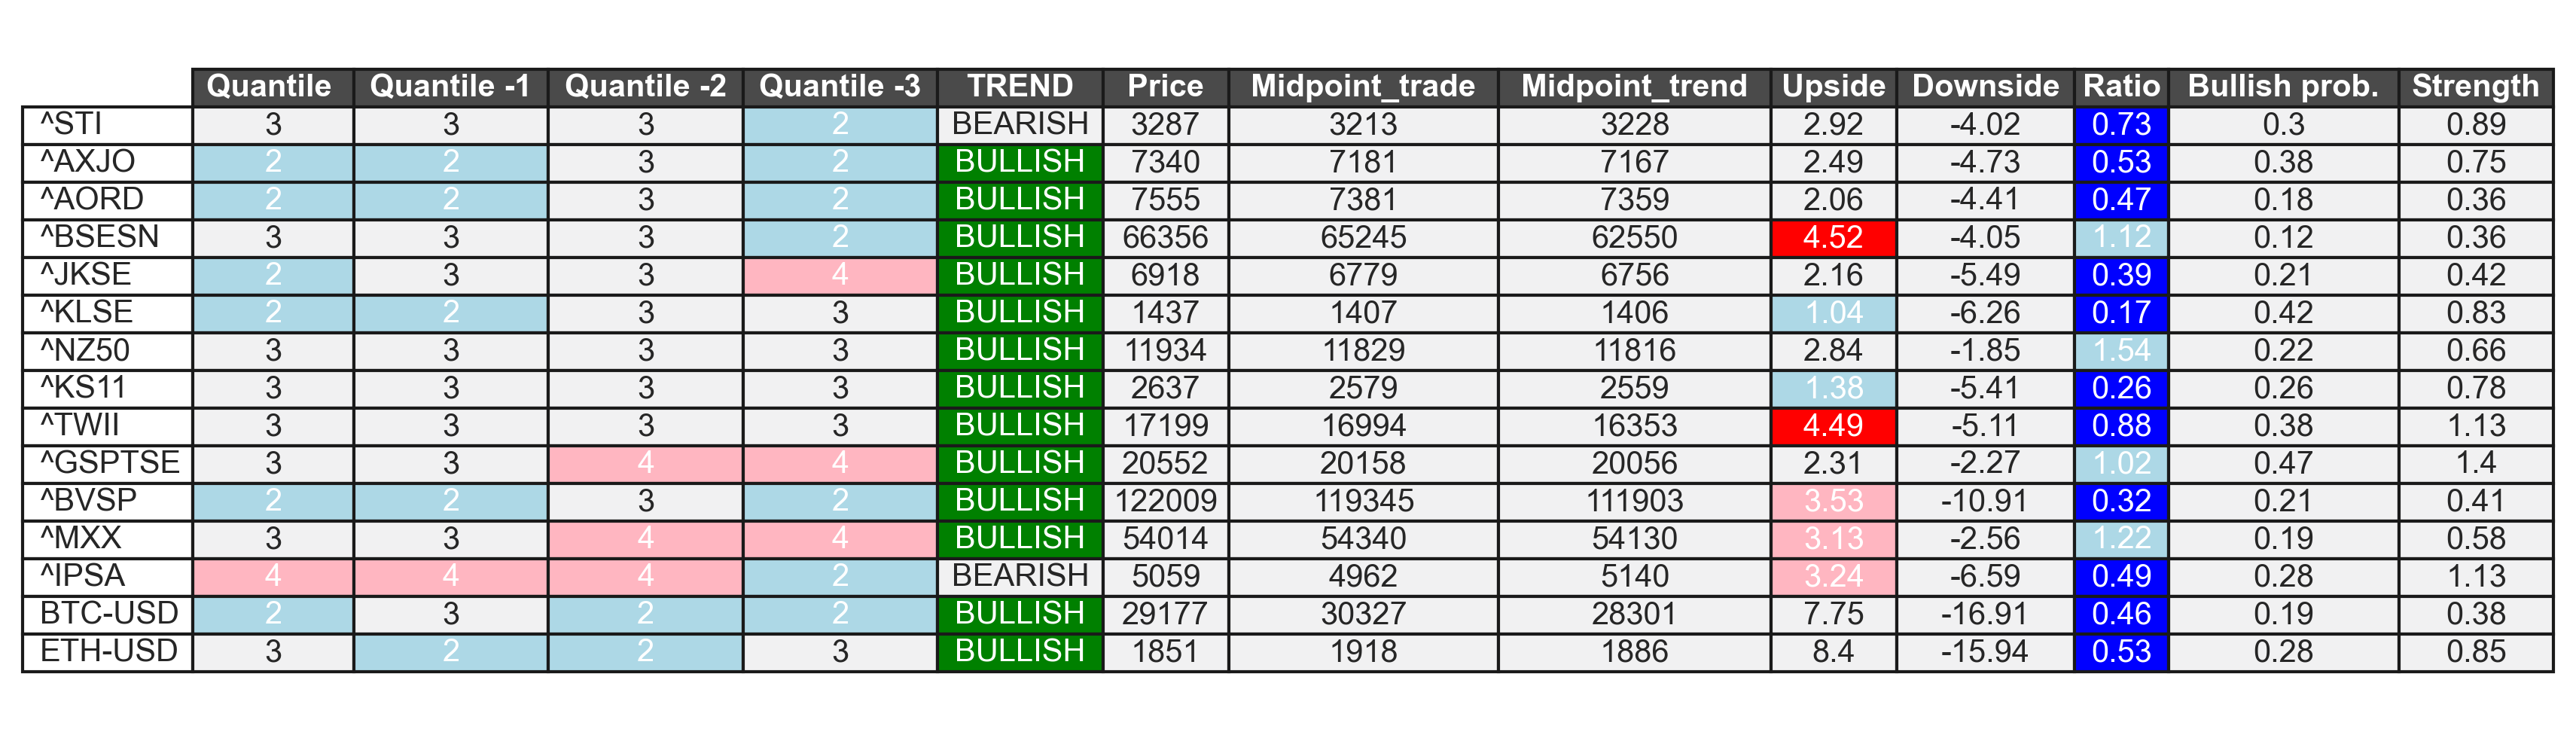
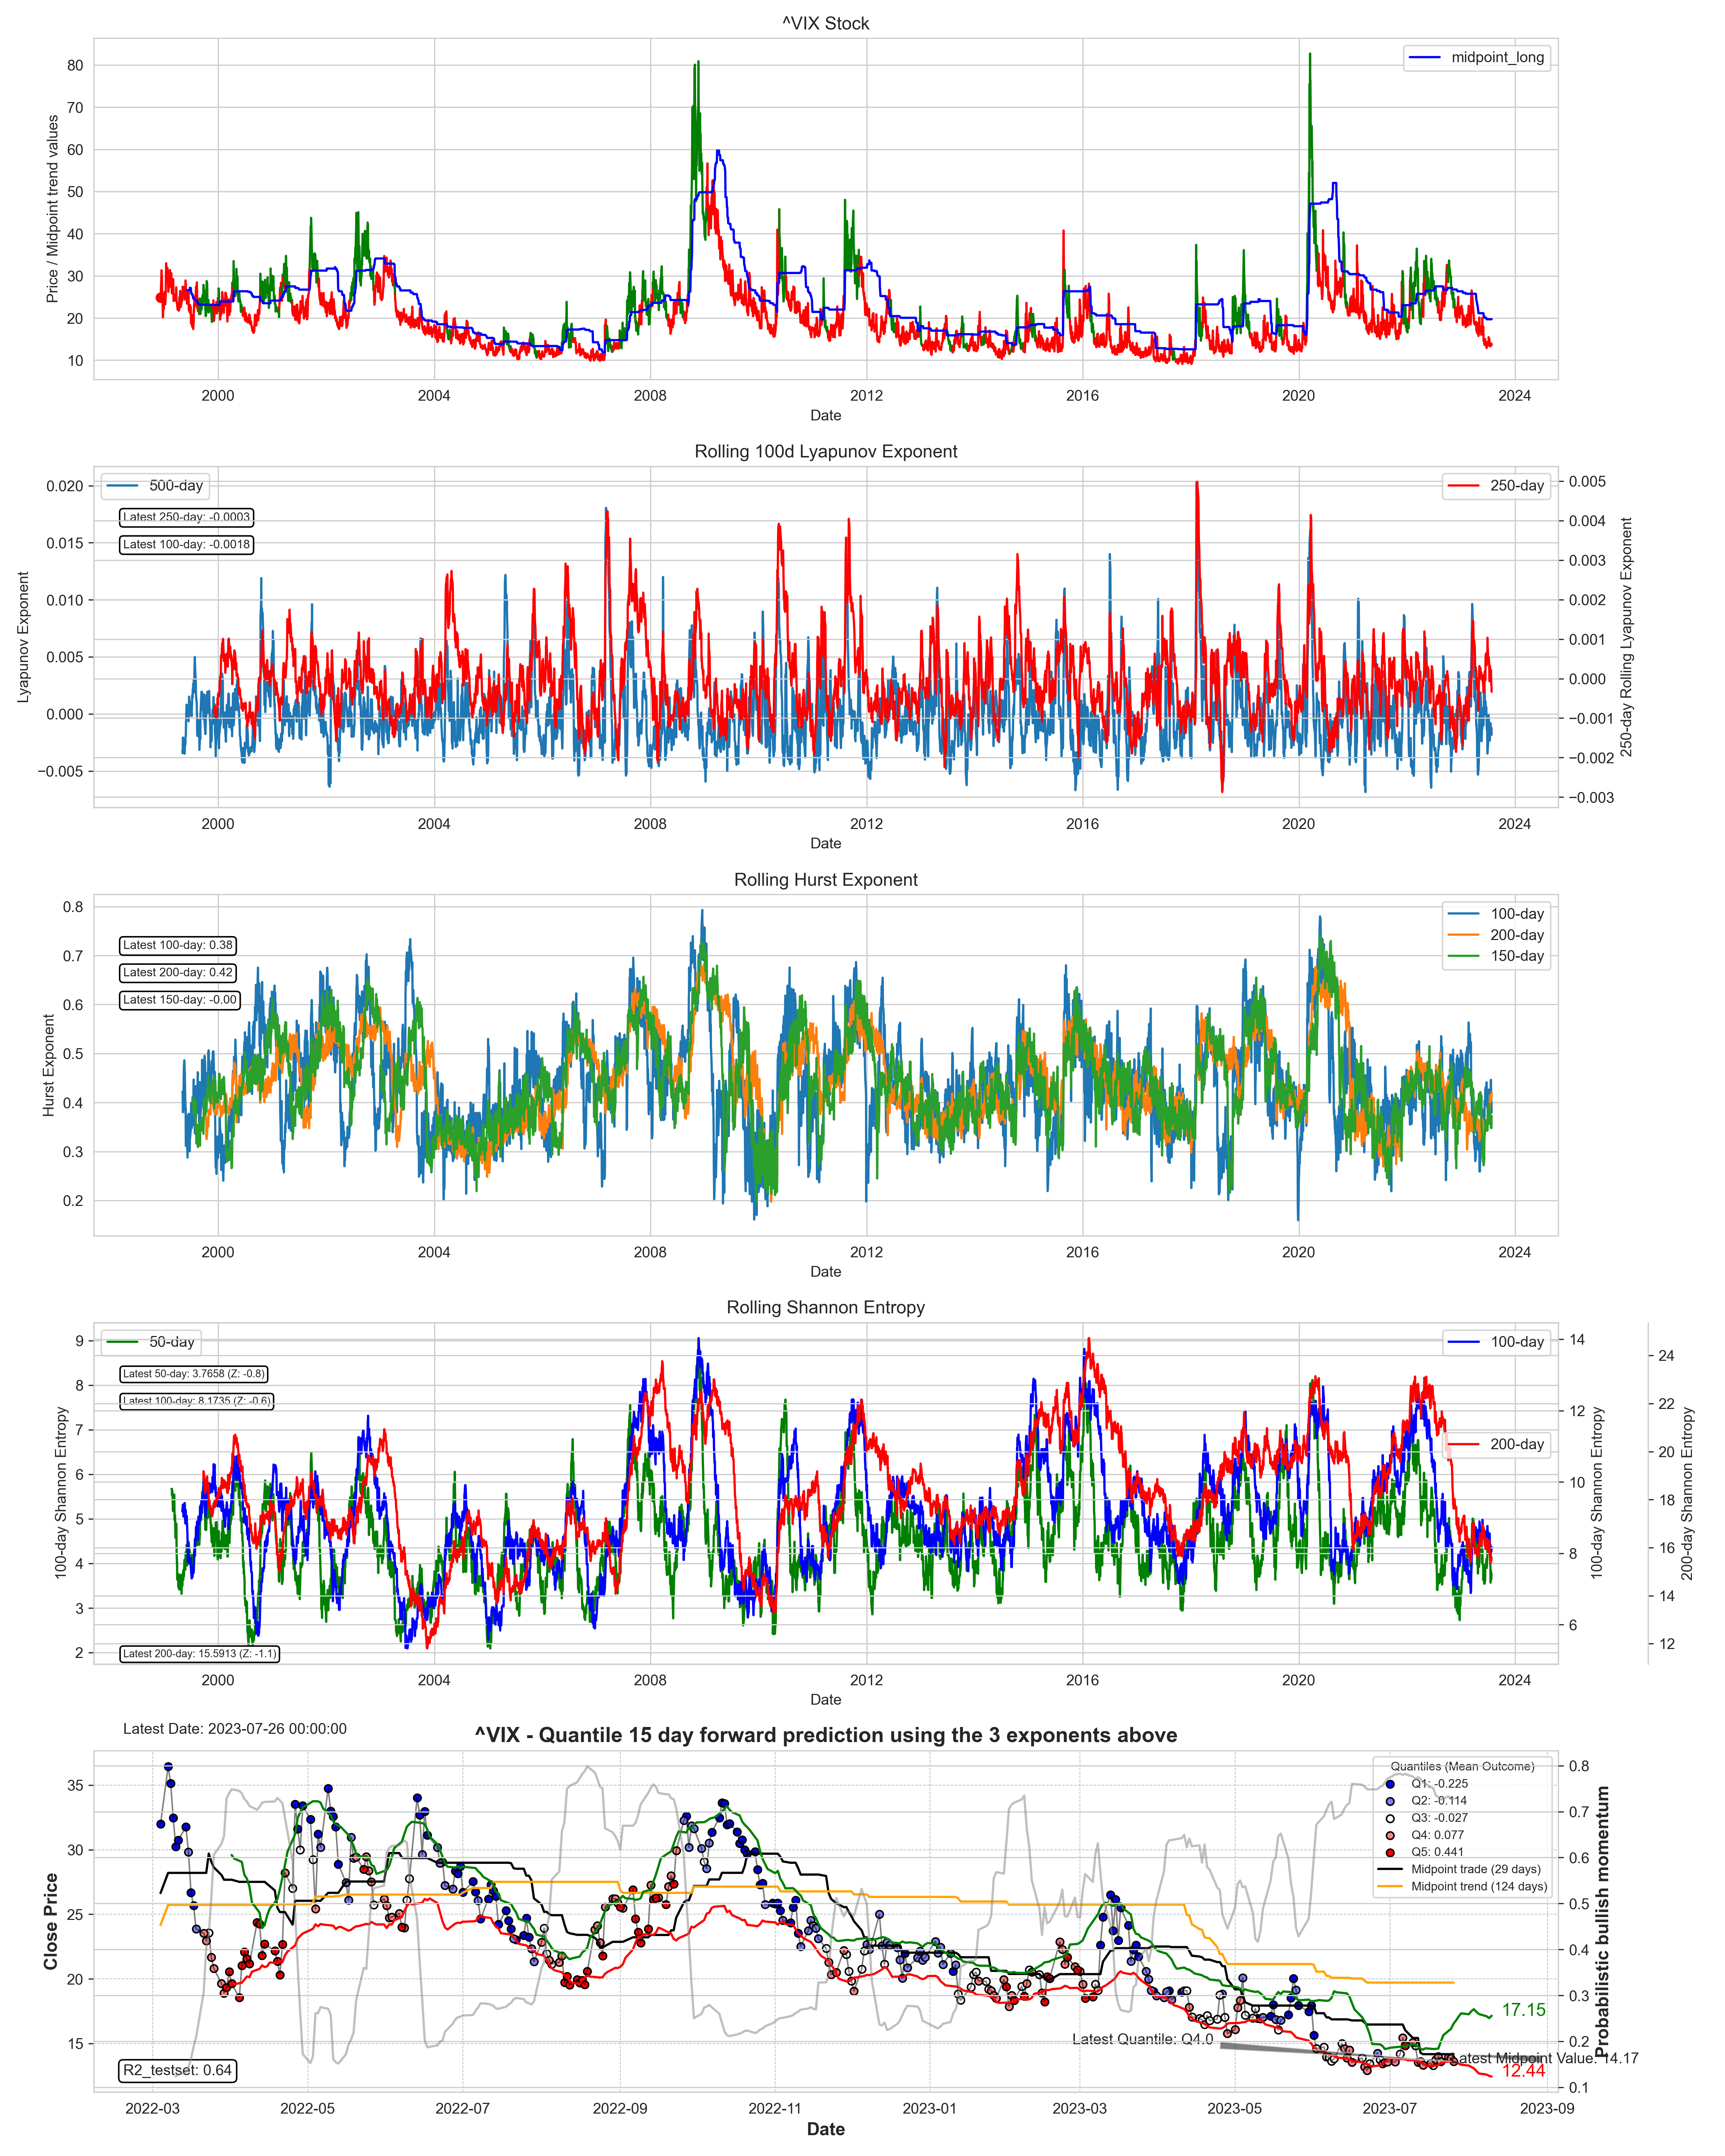
I made some other changes and improvements to the model. I added a likely estimate of upside momentum in forward returns (gray line). This is another layer to assess whether the forward returns structure is supported by all possible estimates. Then I added a volatility analysis to the model, shown in another image. This feature added another 3-8% of validity to the model (depending on the asset). Also the overview now contains a signal strength column, which shows the relationship of the bullish probability and quantile prints ranging from 0 to 4, where 4 is the highest signal strength.
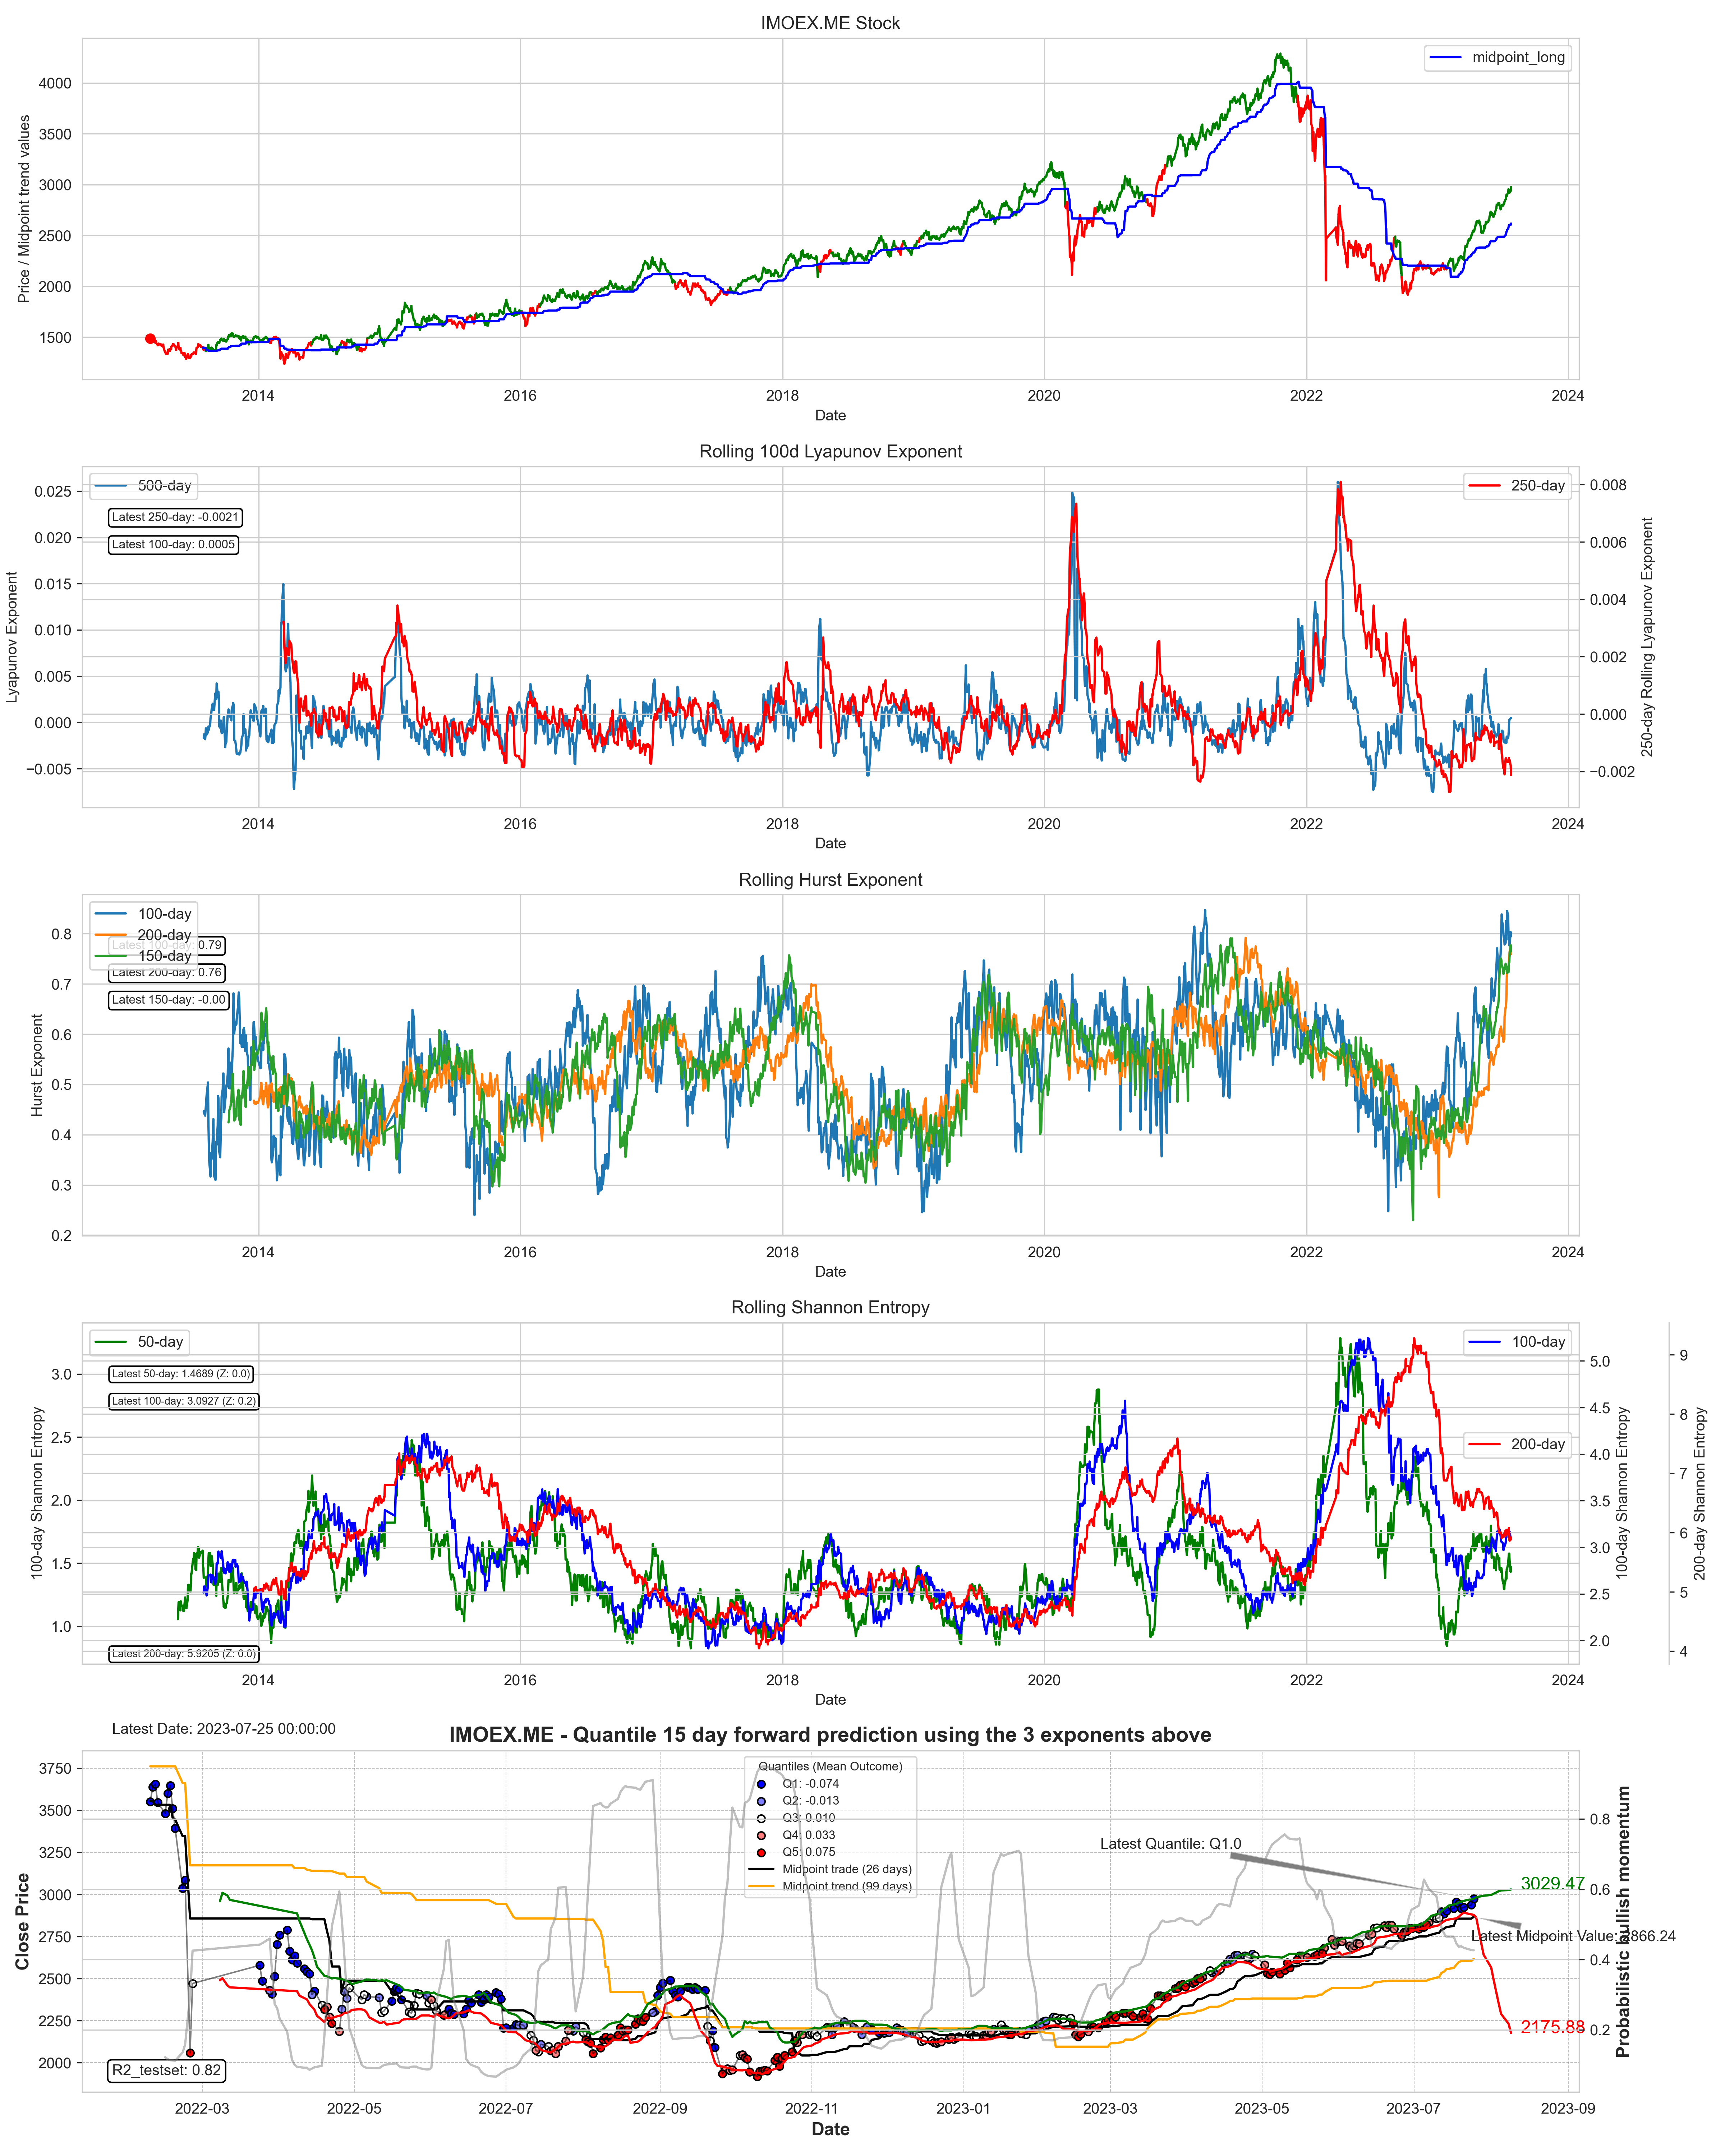
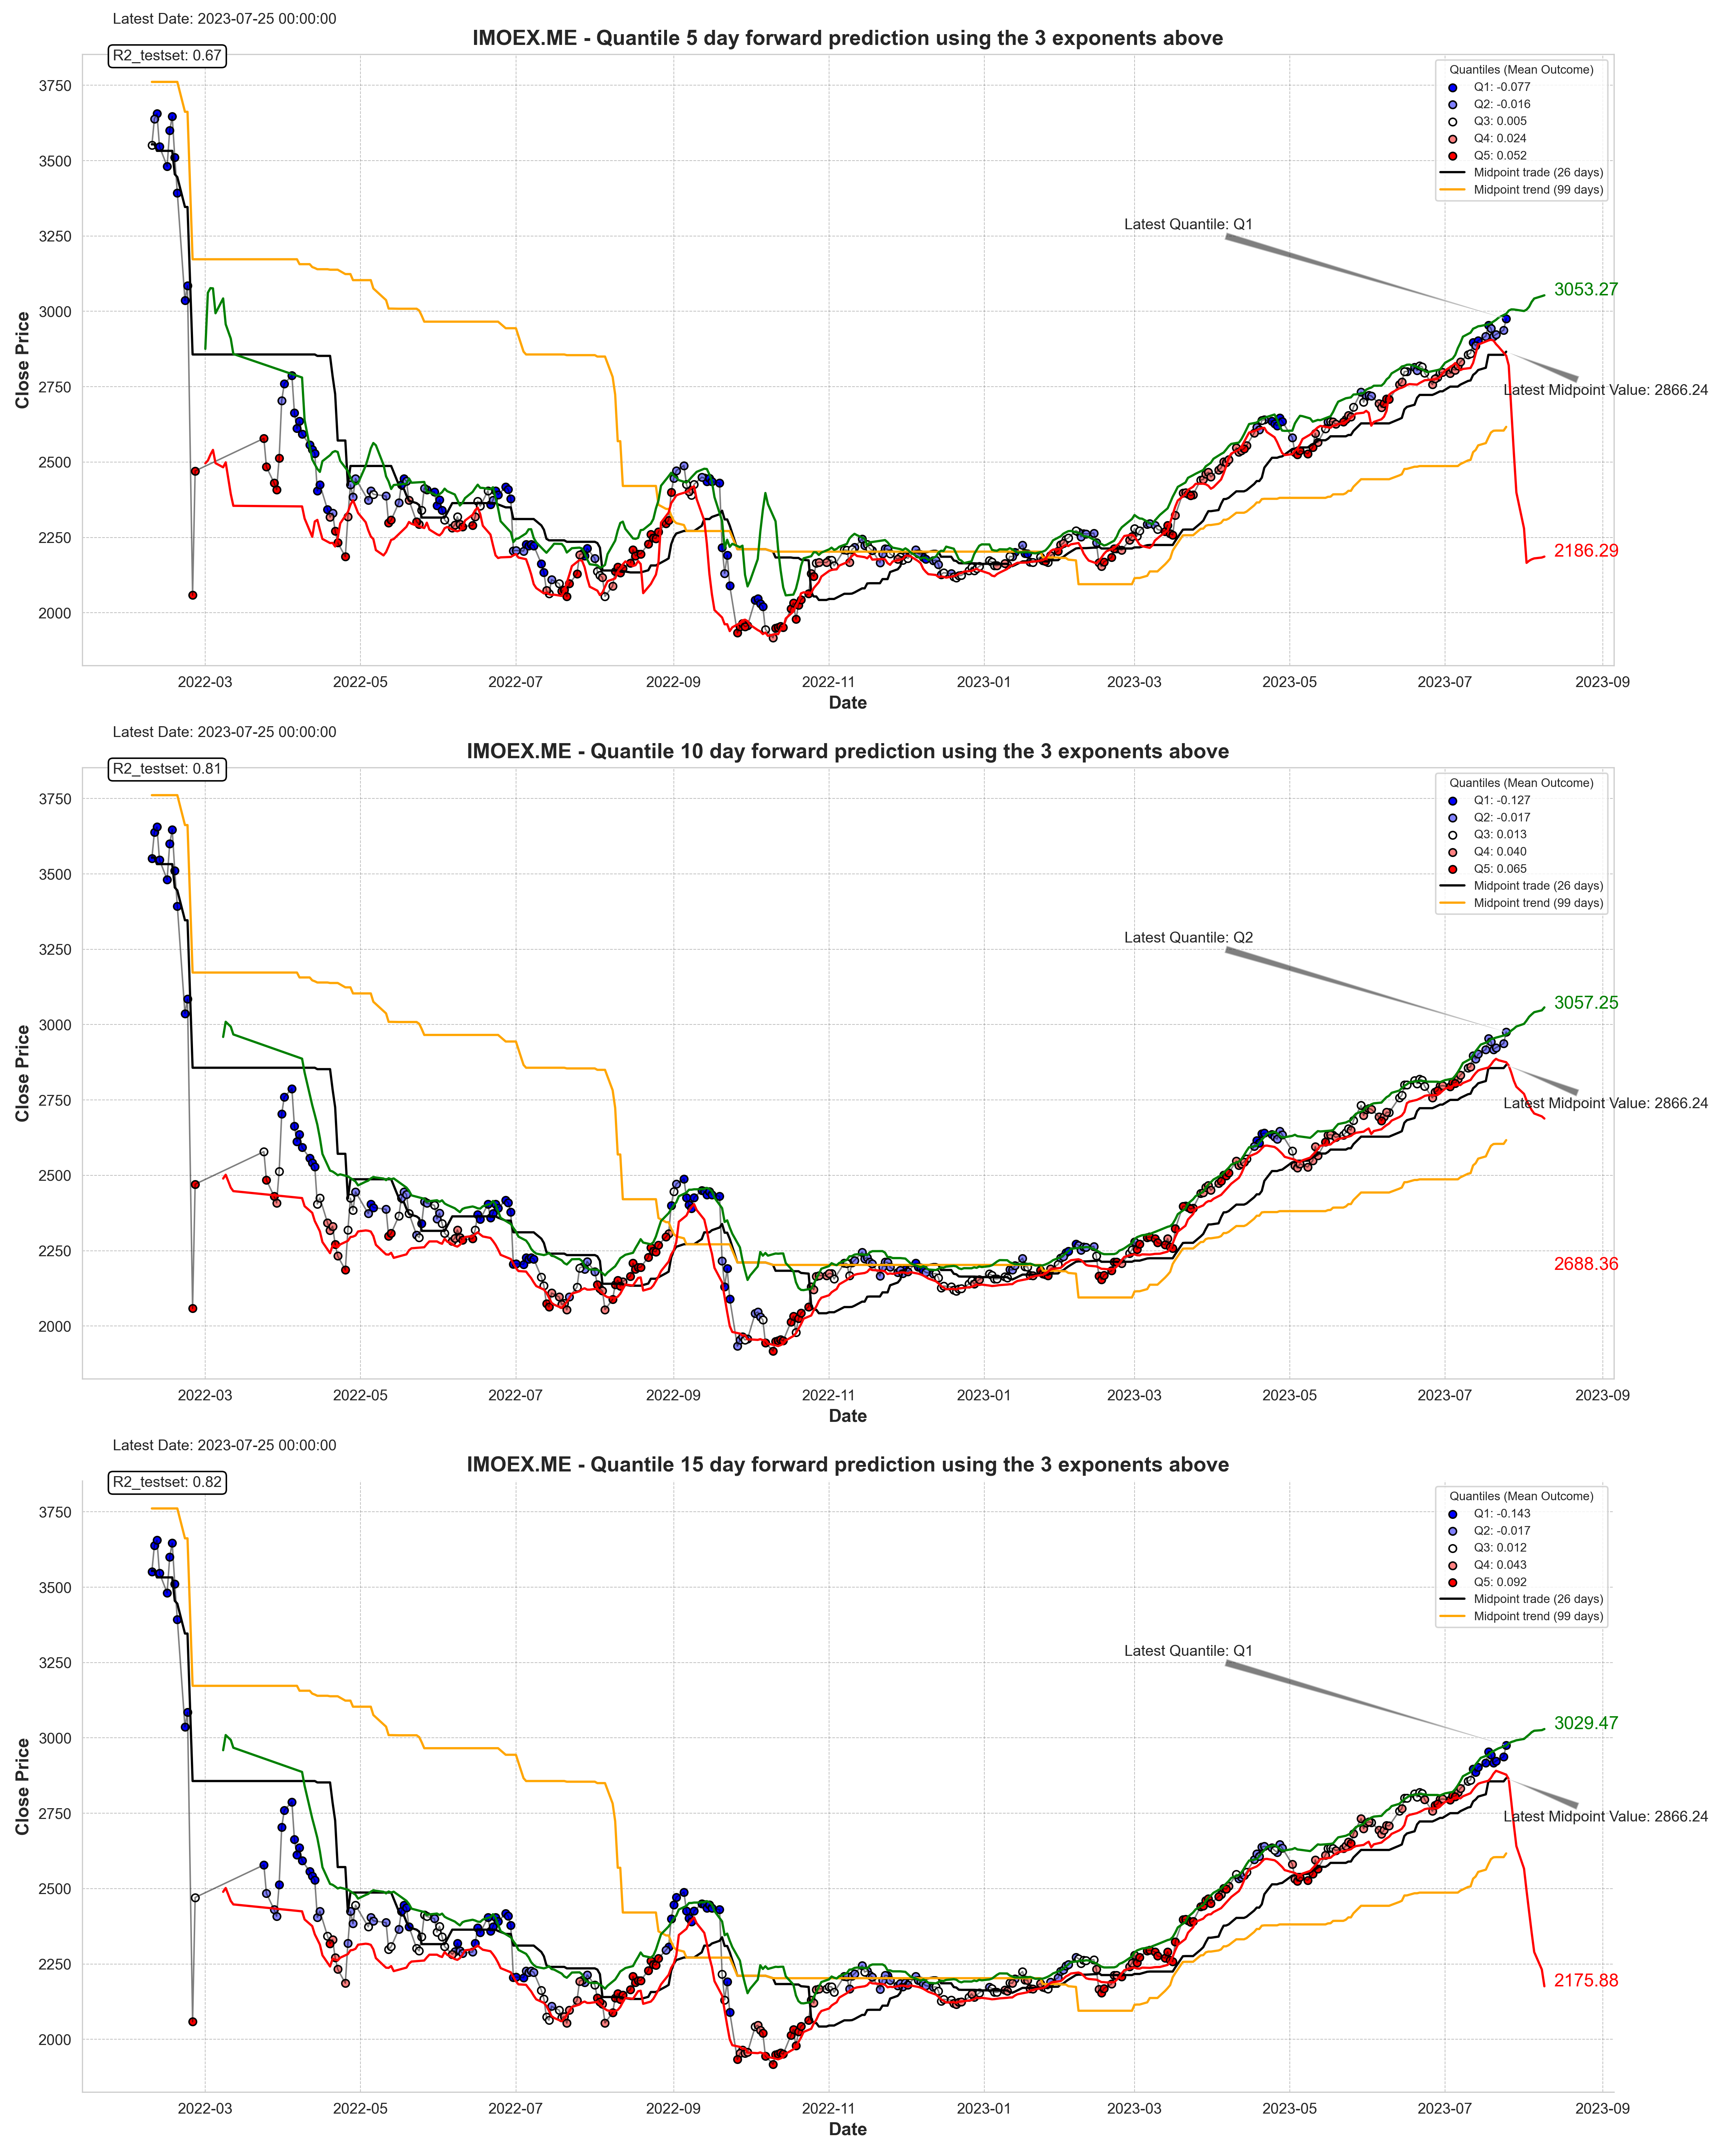
Another update to the model, resulting in another 5% improvement in the prediction of the return. I also split the momentum indicator into two parts, a trading part that optimizes between 5 and 30 days, and a trend part that optimizes between 63 and 126 days. The first subplot now shows the momentum indicator as a color code for the price index. Green is bullish and red is bearish.
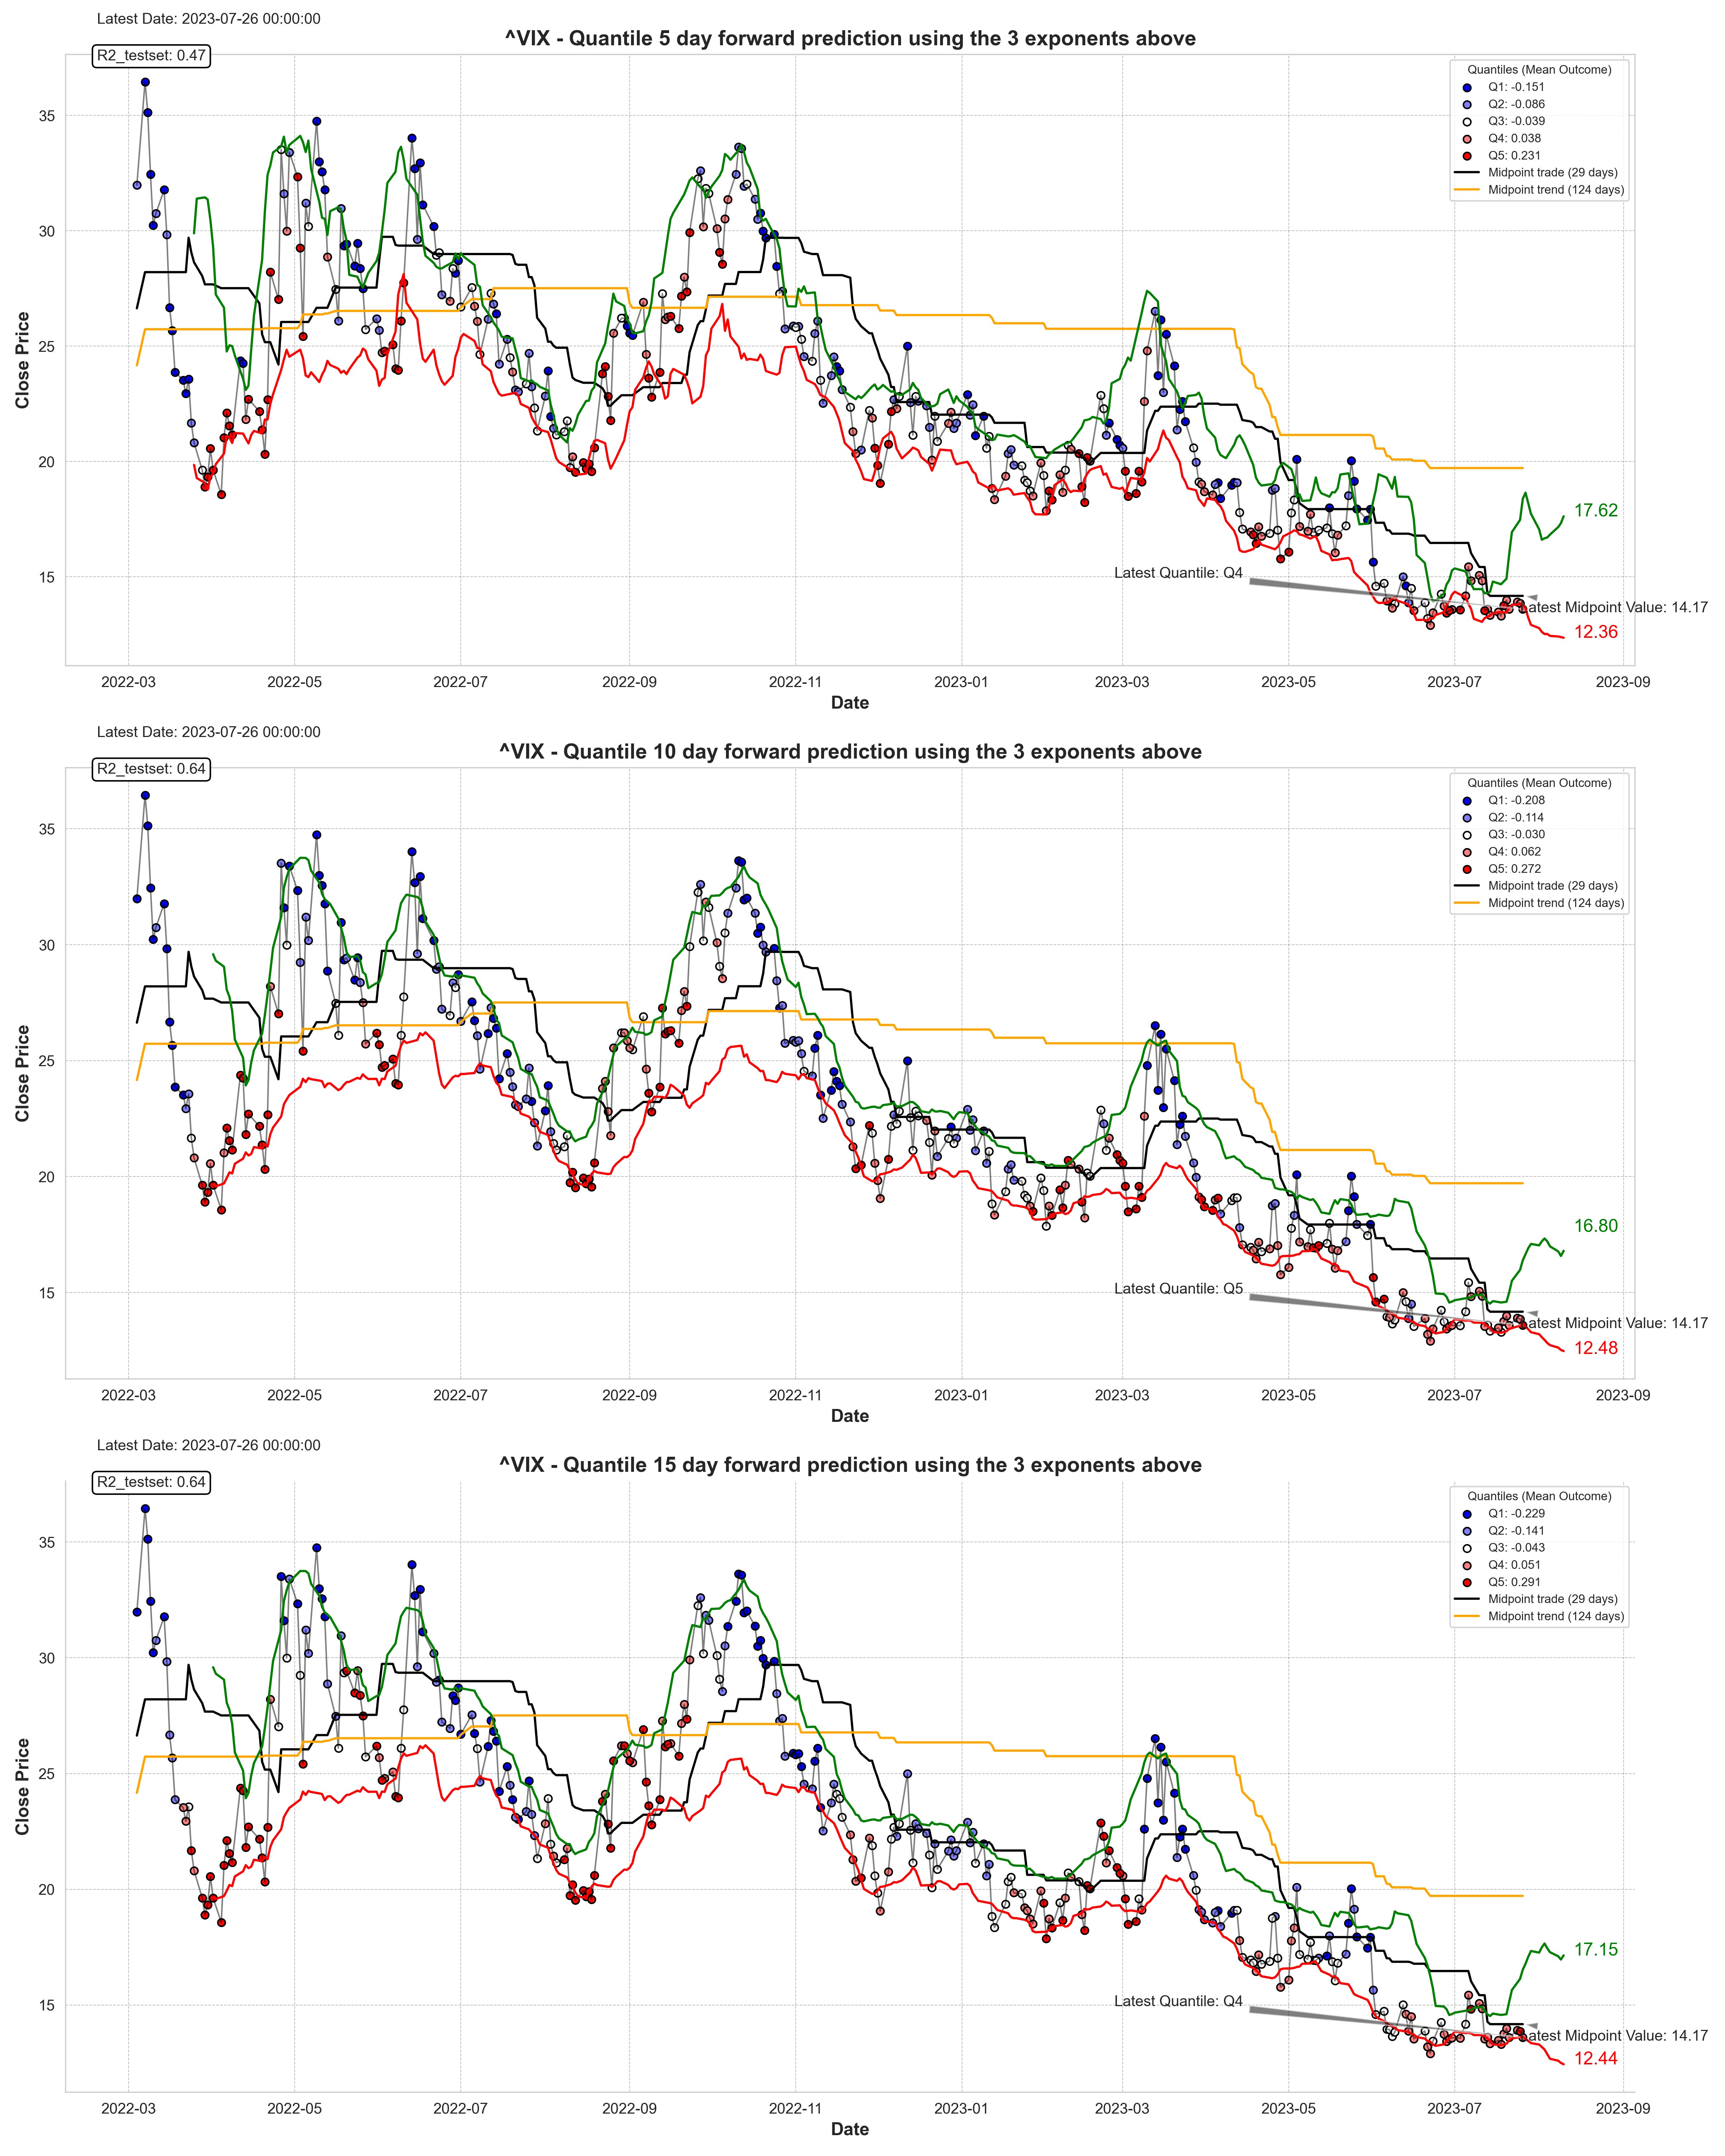
Another addition is the forward return model for two more time frames, the 5-day forward return and the 10-day forward return. In the upper left corner you can see the r-square for the validity of the model.
The overview table have an error, i will add them tomorrow once i updated the model !
Index overview
We see most indices in an uptrend, but without supporting quantile prints (forward returns). The only index that shows an uptrend, favorable quantile prints, and thus high strength is BFX. It shows the most strength and is probably the best trading position. In the charts below you can see the different forward returns for 5, 10 and 15 days in terms of quantiles and their mean forward return. On the short side, the Russian index looks good with several quantile 1 prints, but overall nothing spectacular on the short side. A quantile-1 print was confirmed in all three time frames, which increases the probability of a correction (see chart below). The 90 confidence intervals should show some perspective of a "likely" range with its outliers, the mean of the confidence intervals, i.e., the forward return for quantile 1 is the most likely outcome for the index.
LONG:
New: 3 different time frames for the forward return model

SHORTS:
Last weeks return (5 days:)
Long:
VIX +2,79%
BVSP +2,53%
Short:
BTC -1,56%
Yearly coupon:
monthly coupon:
Keep reading with a 7-day free trial
Subscribe to This Time is Different to keep reading this post and get 7 days of free access to the full post archives.