Weekly roundup #18
Forward Return Analysis & macro data roundup
This Content is intended for educational purposes only. No portion of this Content purports to be, individualized or specific investment advice and is not created to provide investment advice to individuals. All information provided is impersonal, general in nature and is made without regard to individual levels of sophistication or investment experience, investment preferences, objectives or risk parameters and without regard to the suitability of the Content for individuals or entities who may access it. No information found on this Newsletter, nor any Services provided, should be construed as an offer to sell, or a solicitation of an offer to buy any security or investment vehicle, nor should it be construed as tailored or specific to you, or any reader or consumer thereof. You understand and agree that this Content does not constitute specific recommendations of any particular investment, security, portfolio, transaction or strategy, nor does it recommend any specific course of action is suitable for any specific person or entity or group of persons or entities.
This is a new weekly series where you will get a number of indices and ETFs analyzed using the "Recognizing Market Chaos" framework. I will highlight the best opportunities based on the overviews and include the image in the blog post. This is the first post for the new theme, so I need a little more time to adjust the content and find the right way to deliver the most value.
For an introduction, see the posts on recognizing chaos in the market.
Recognizing the chaos in the markets #2

This Content is intended for educational purposes only. No portion of this Content purports to be, individualized or specific investment advice and is not created to provide investment advice to individuals. All information provided is impersonal, general in nature and is made without regard to individual levels of sophistication or investment experience, investment preferences, objectives or risk parameters and without regard to the suitability of the Content for individuals or entities who may access it. No information found on this Newsletter, nor any Services provided, should be construed as an offer to sell, or a solicitation of an offer to buy any security or investment vehicle, nor should it be construed as tailored or specific to you, or any reader or consumer thereof. You understand and agree that this Content does not constitute specific recommendations of any particular investment, security, portfolio, transaction or strategy, nor does it recommend any specific course of action is suitable for any specific person or entity or group of persons or entities
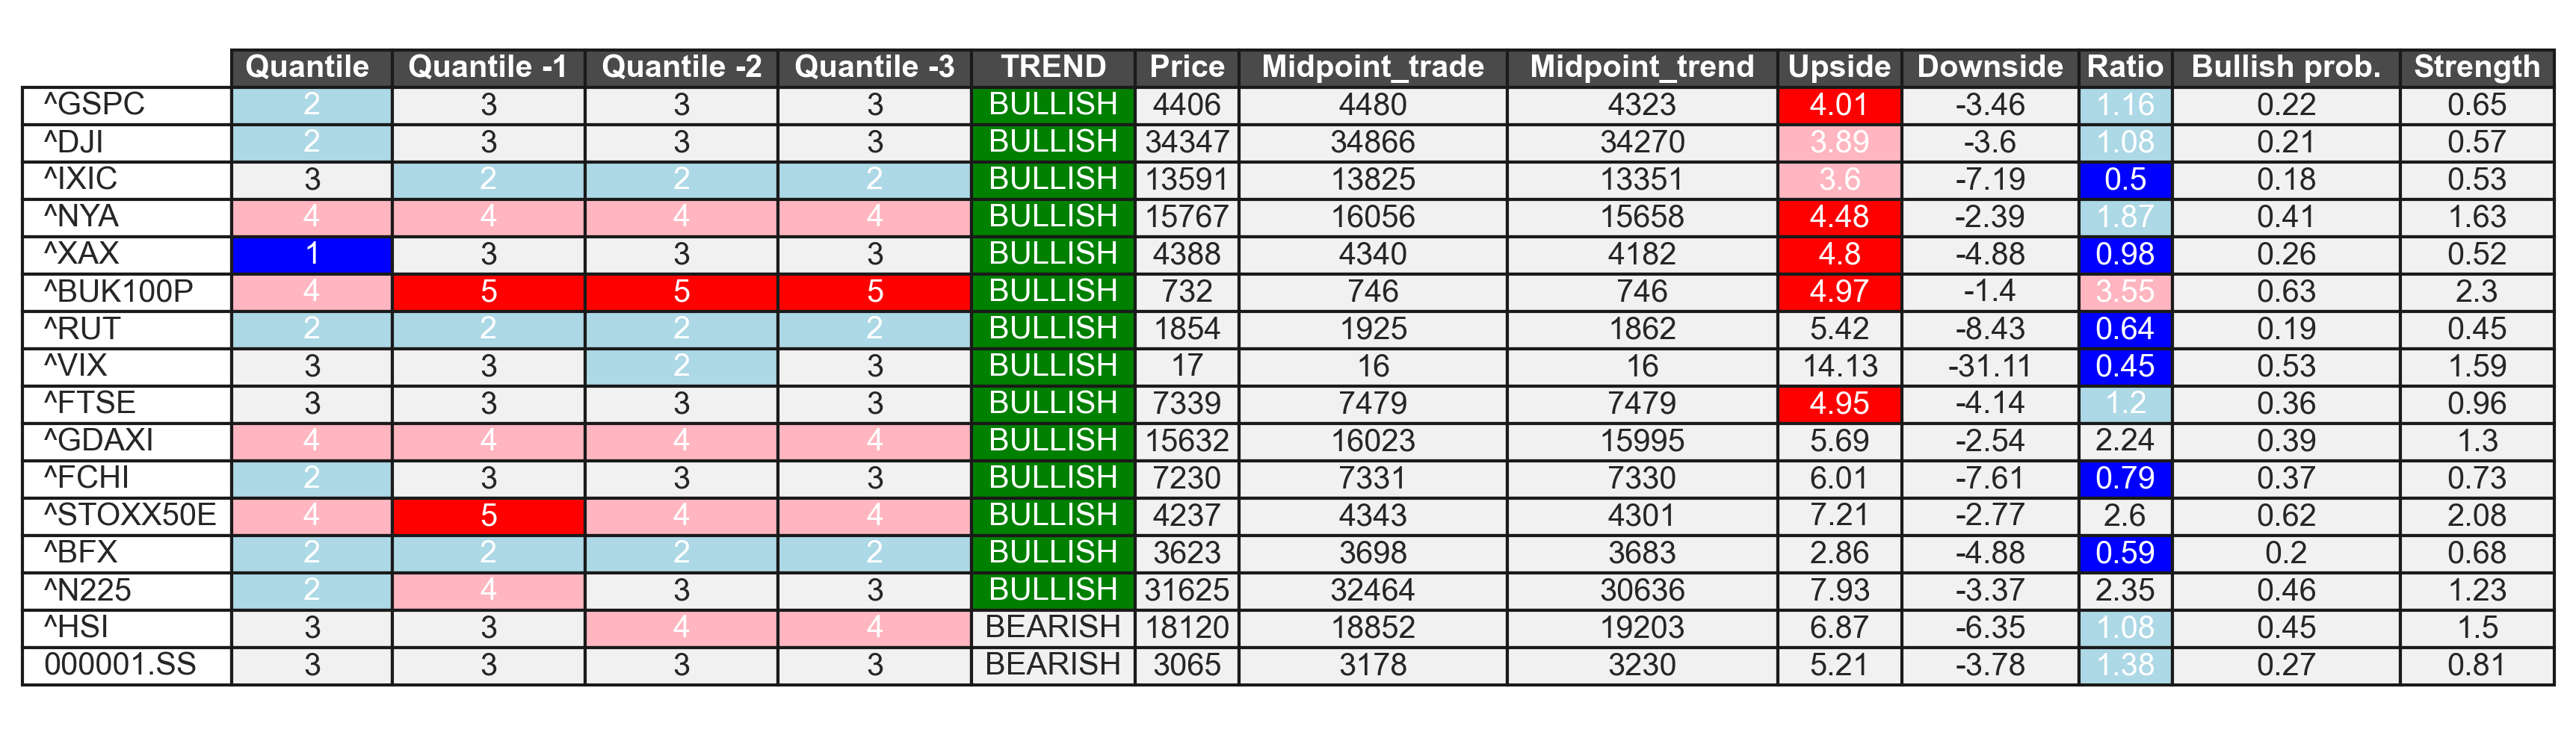
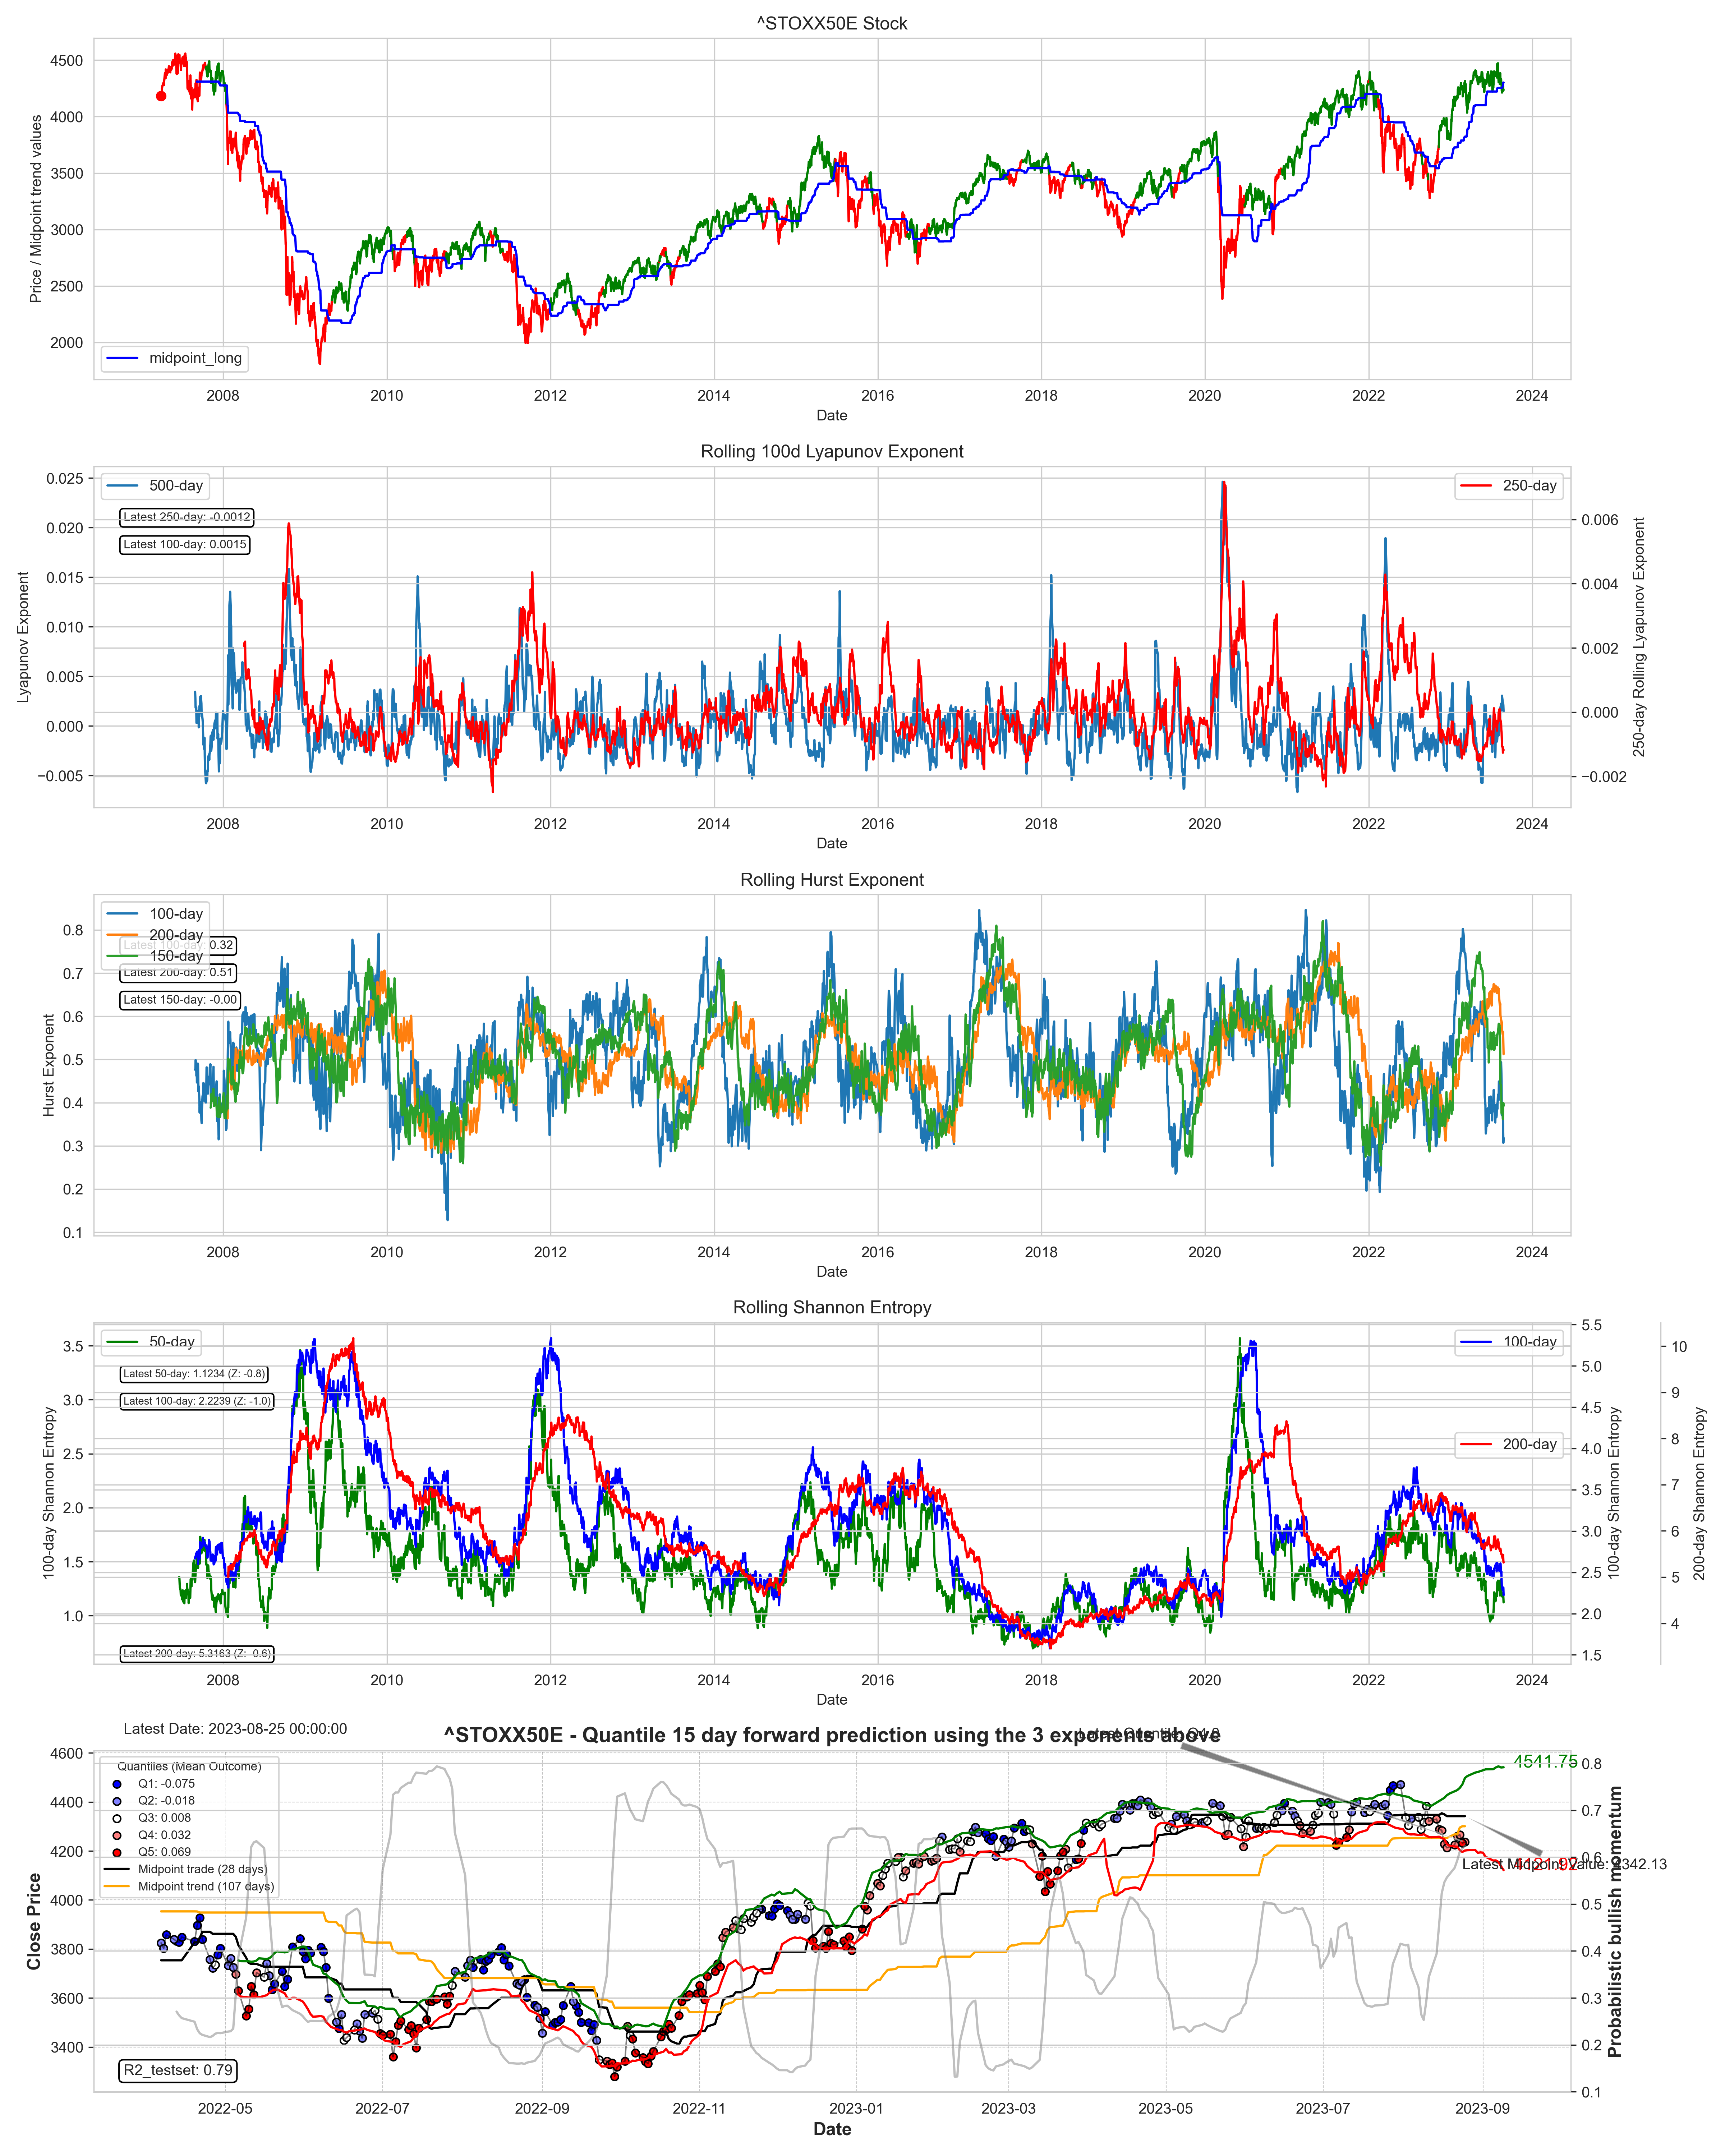
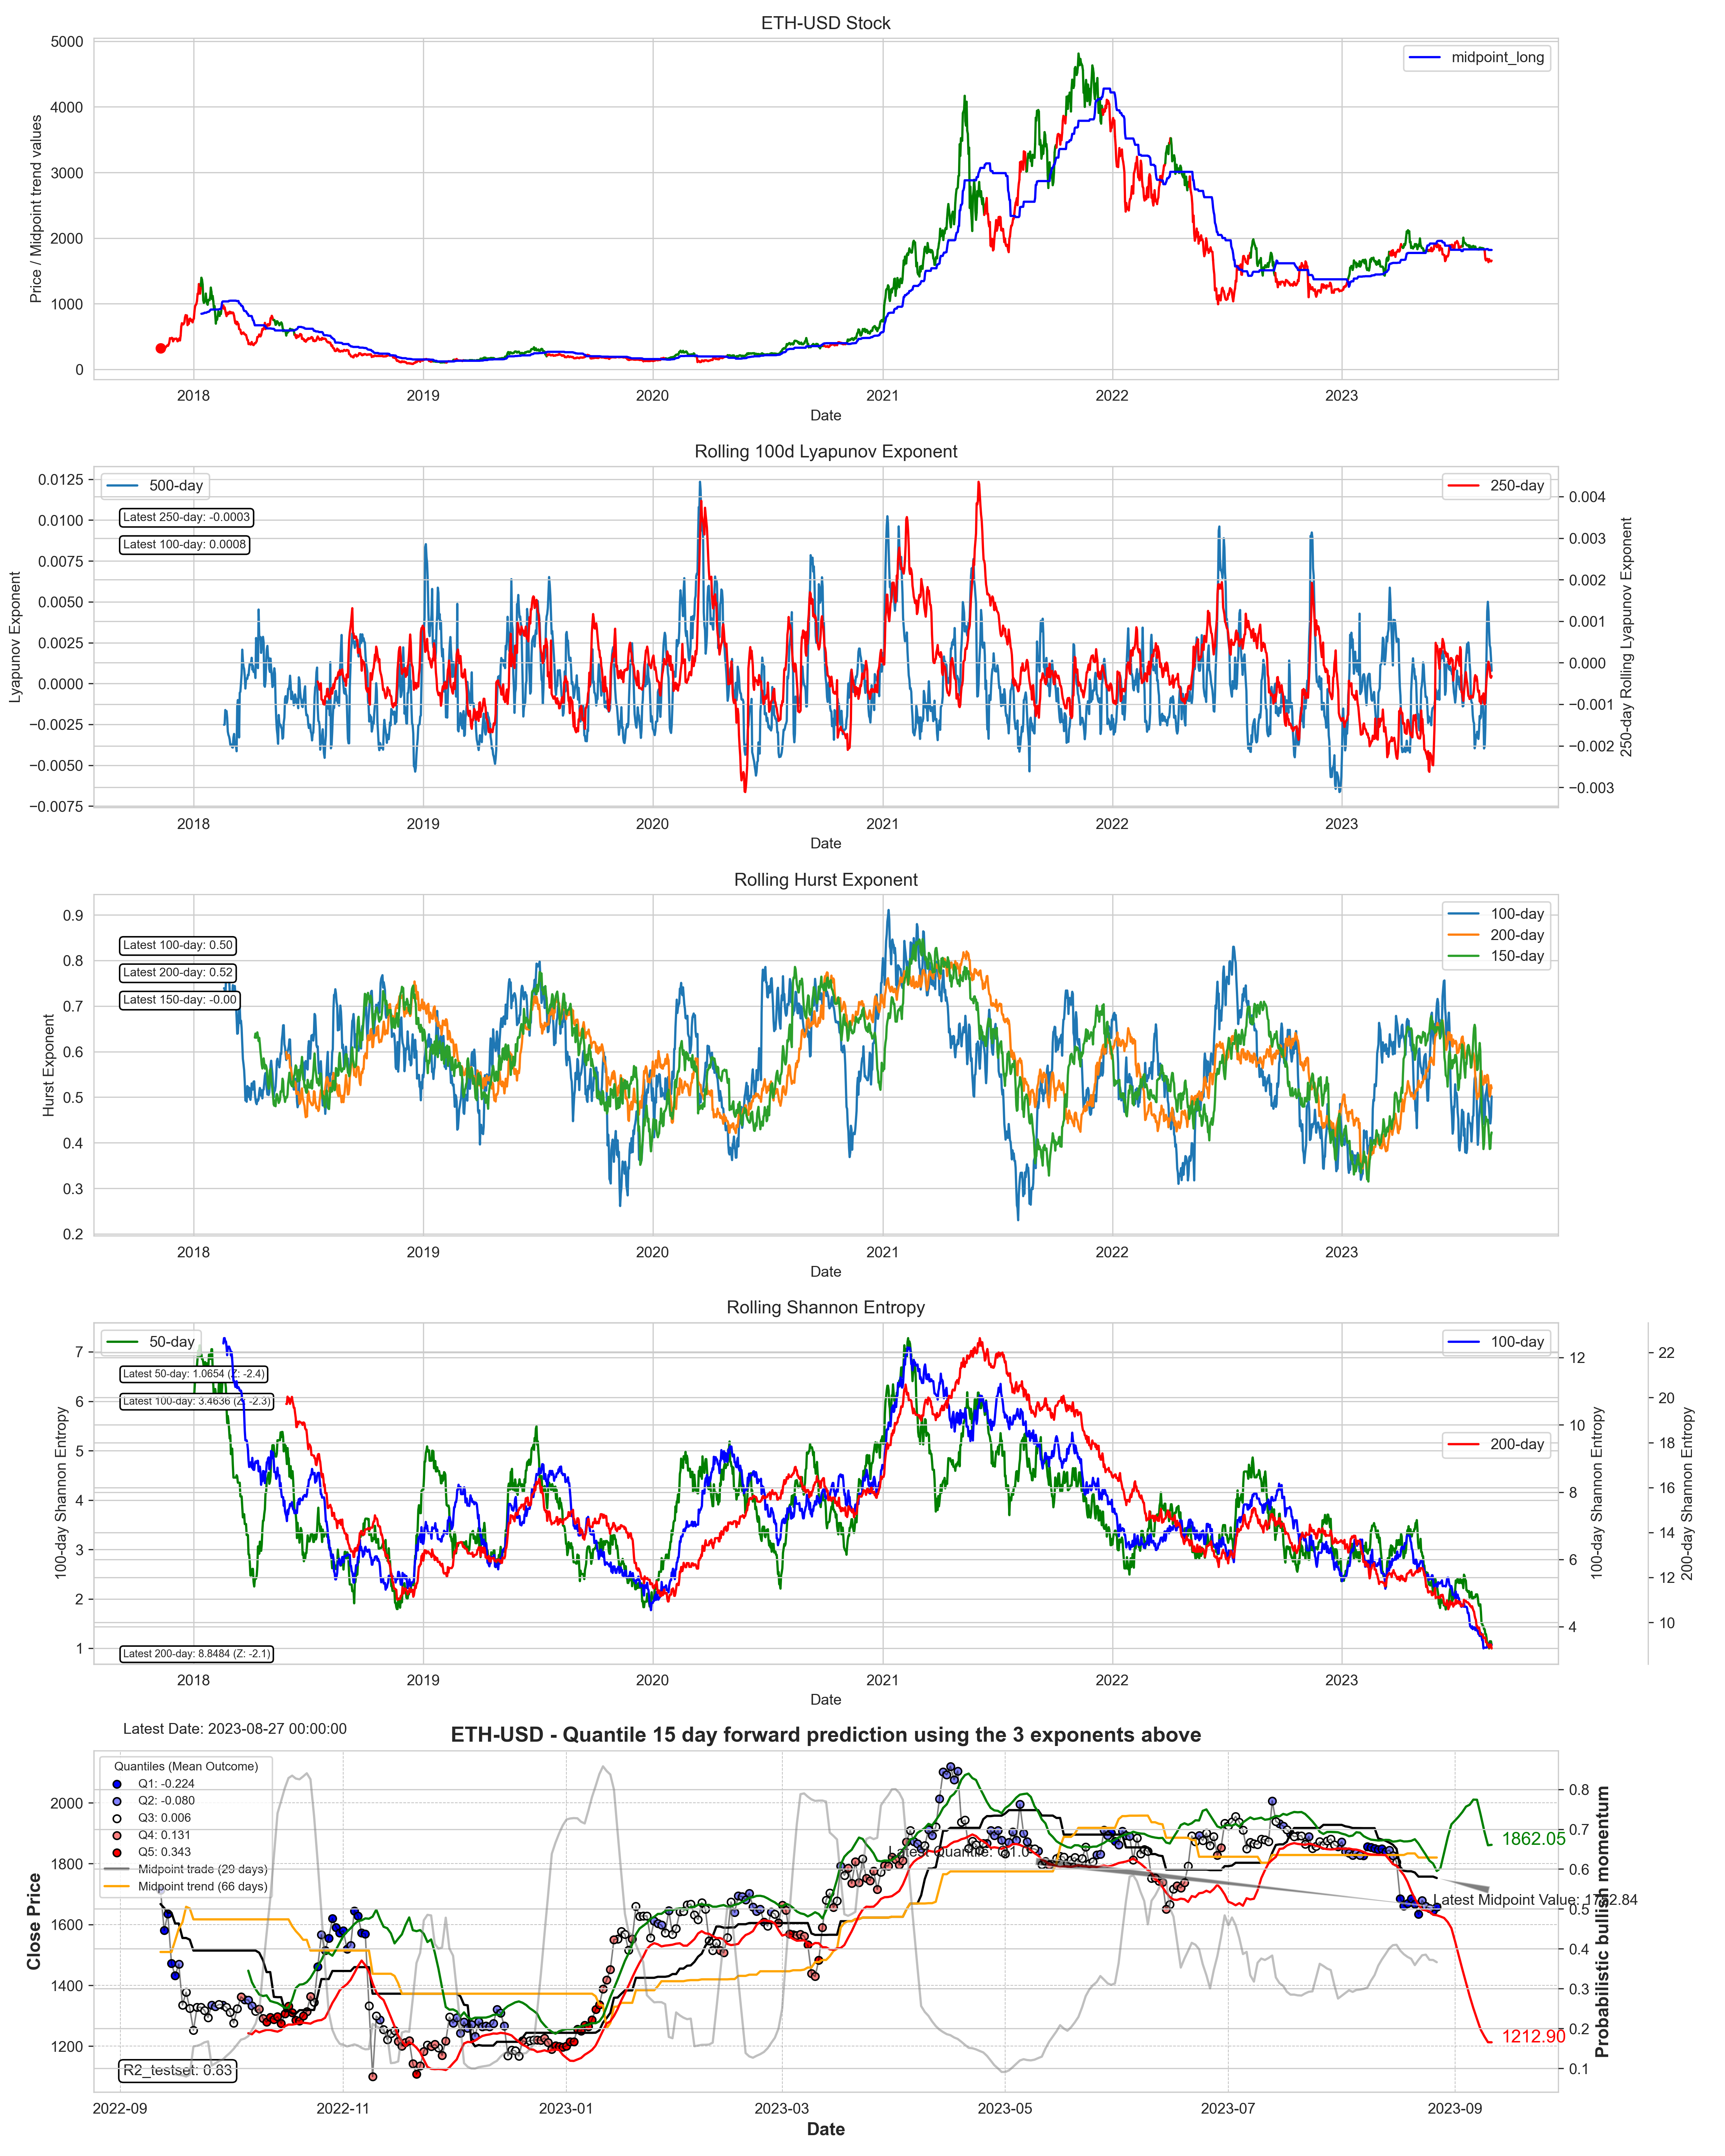
I made some other changes and improvements to the model. I added a likely estimate of upside momentum in forward returns (gray line). This is another layer to assess whether the forward returns structure is supported by all possible estimates. Then I added a volatility analysis to the model, shown in another image. This feature added another 3-8% of validity to the model (depending on the asset). Also the overview now contains a signal strength column, which shows the relationship of the bullish probability and quantile prints ranging from 0 to 4, where 4 is the highest signal strength.
Another update to the model, resulting in another 5% improvement in the prediction of the return. I also split the momentum indicator into two parts, a trading part that optimizes between 5 and 30 days, and a trend part that optimizes between 63 and 126 days. The first subplot now shows the momentum indicator as a color code for the price index. Green is bullish and red is bearish.
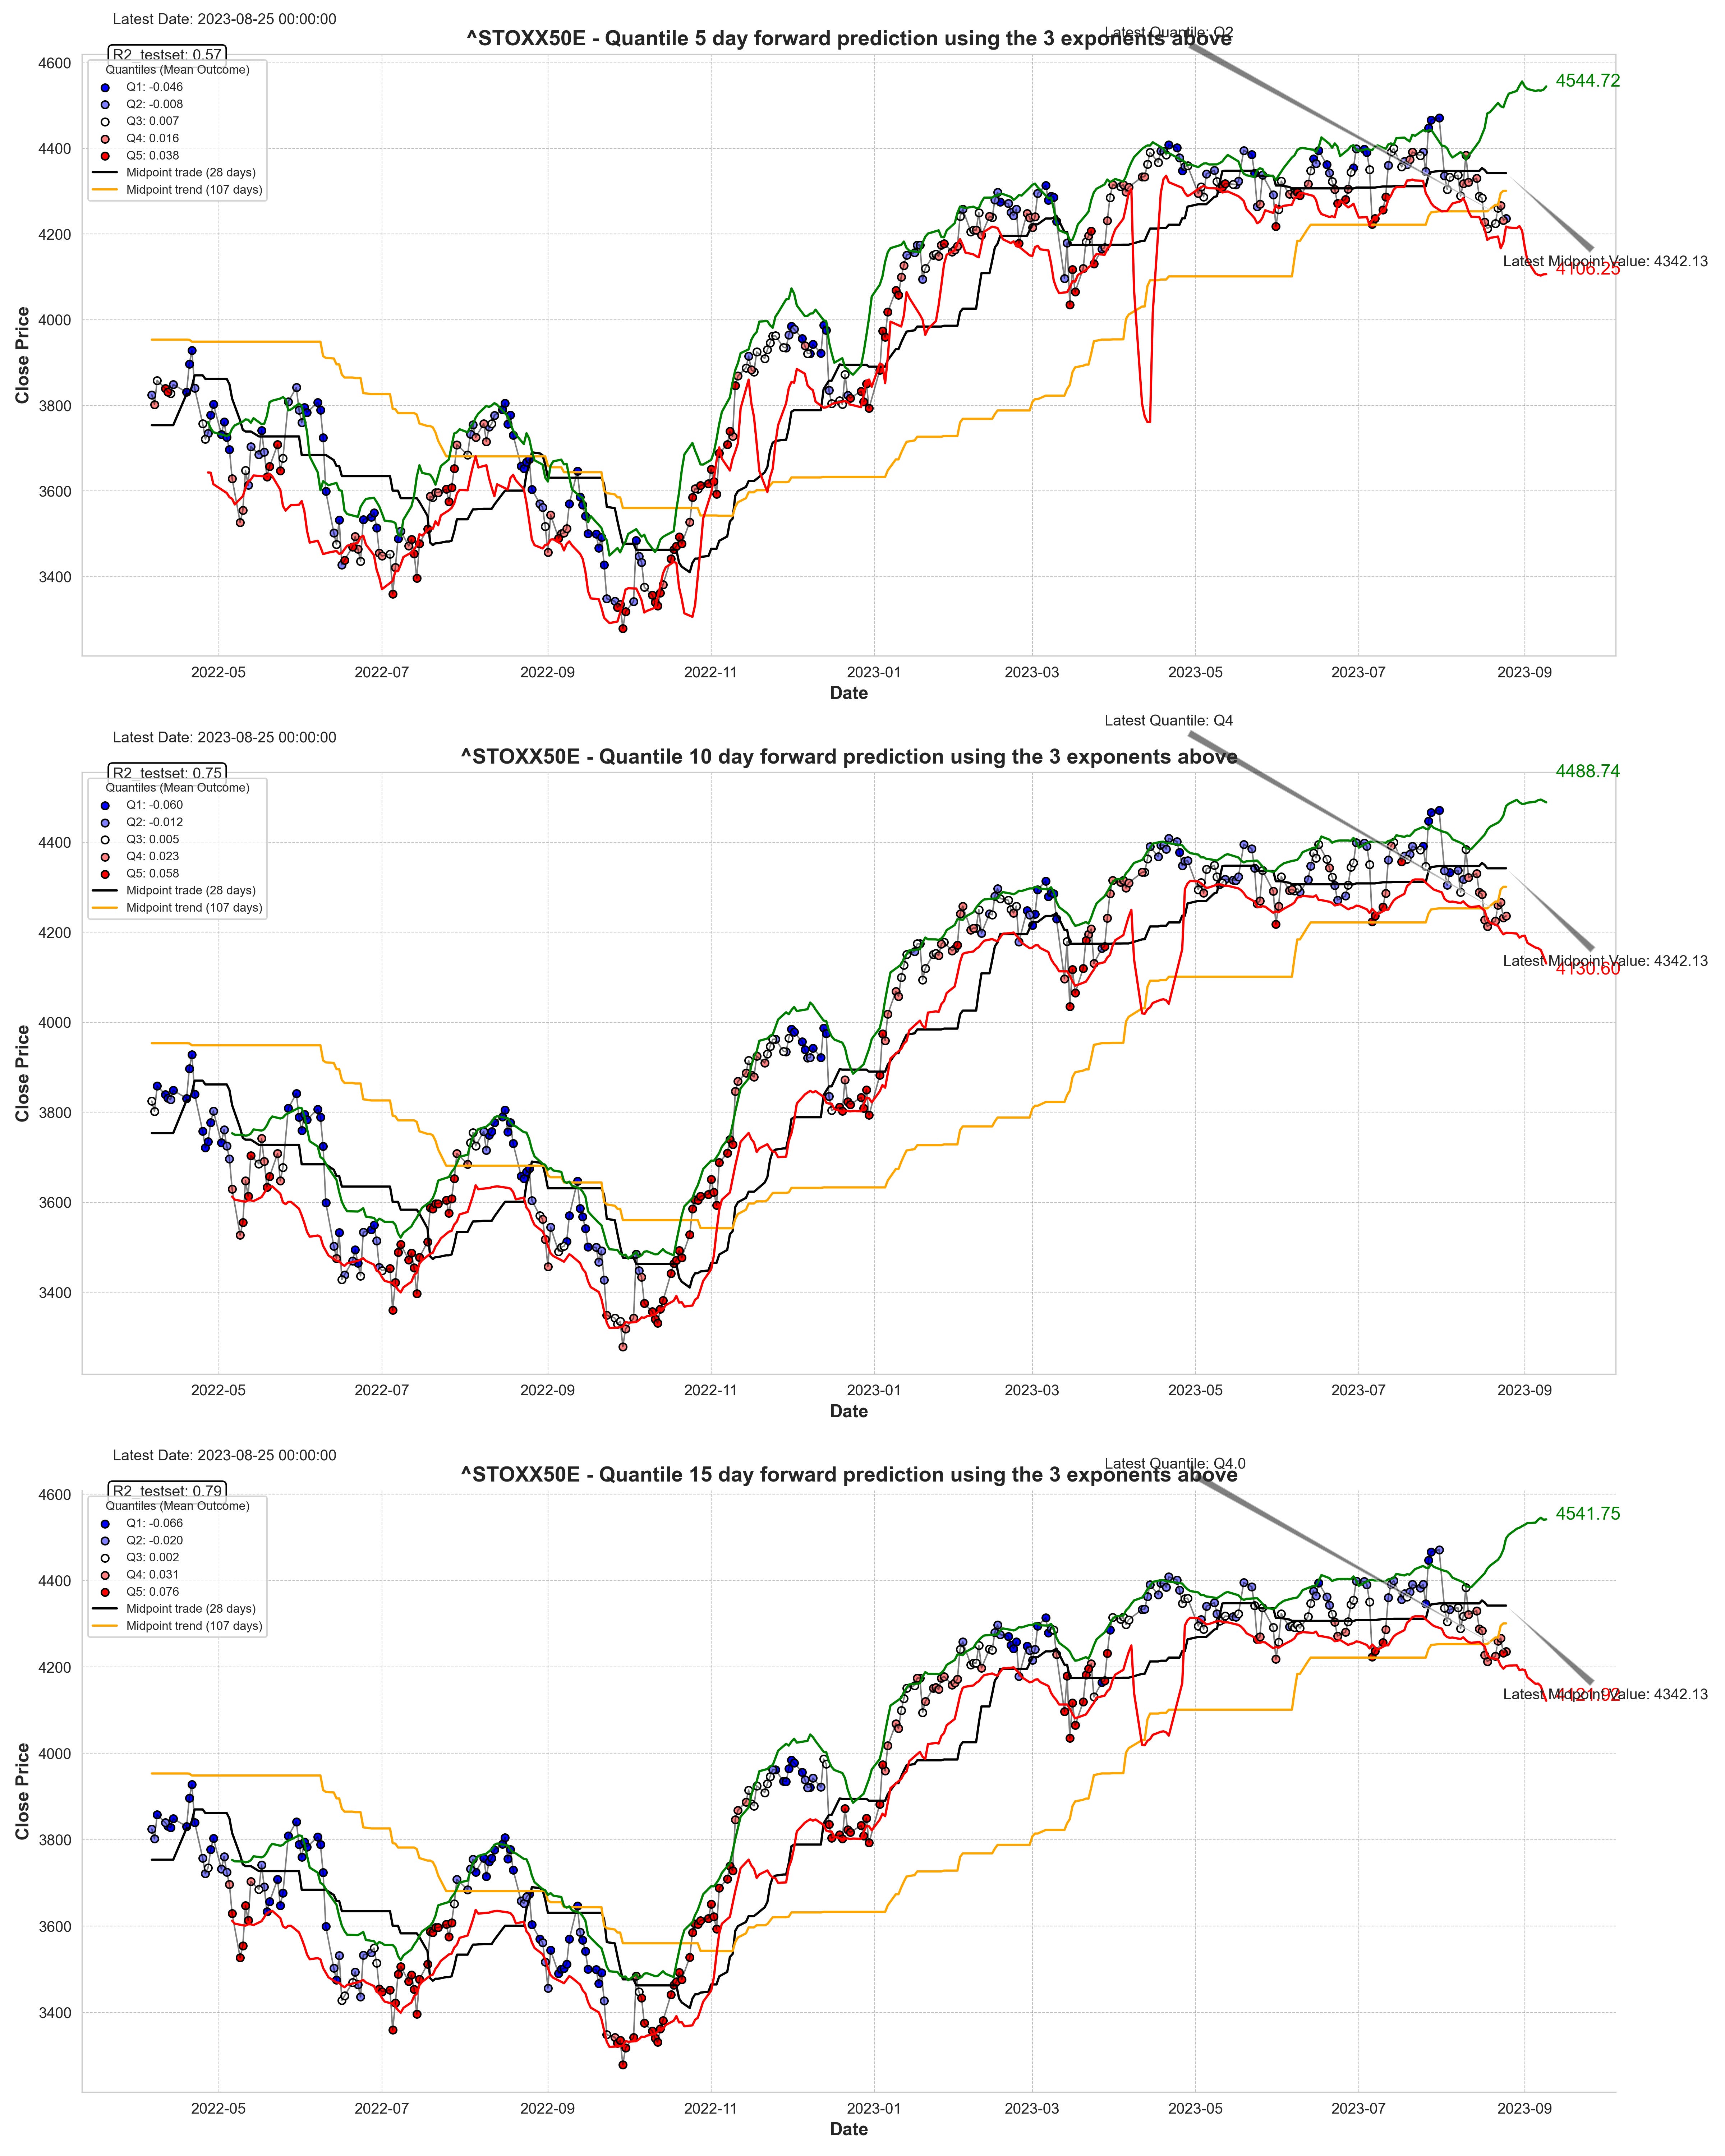
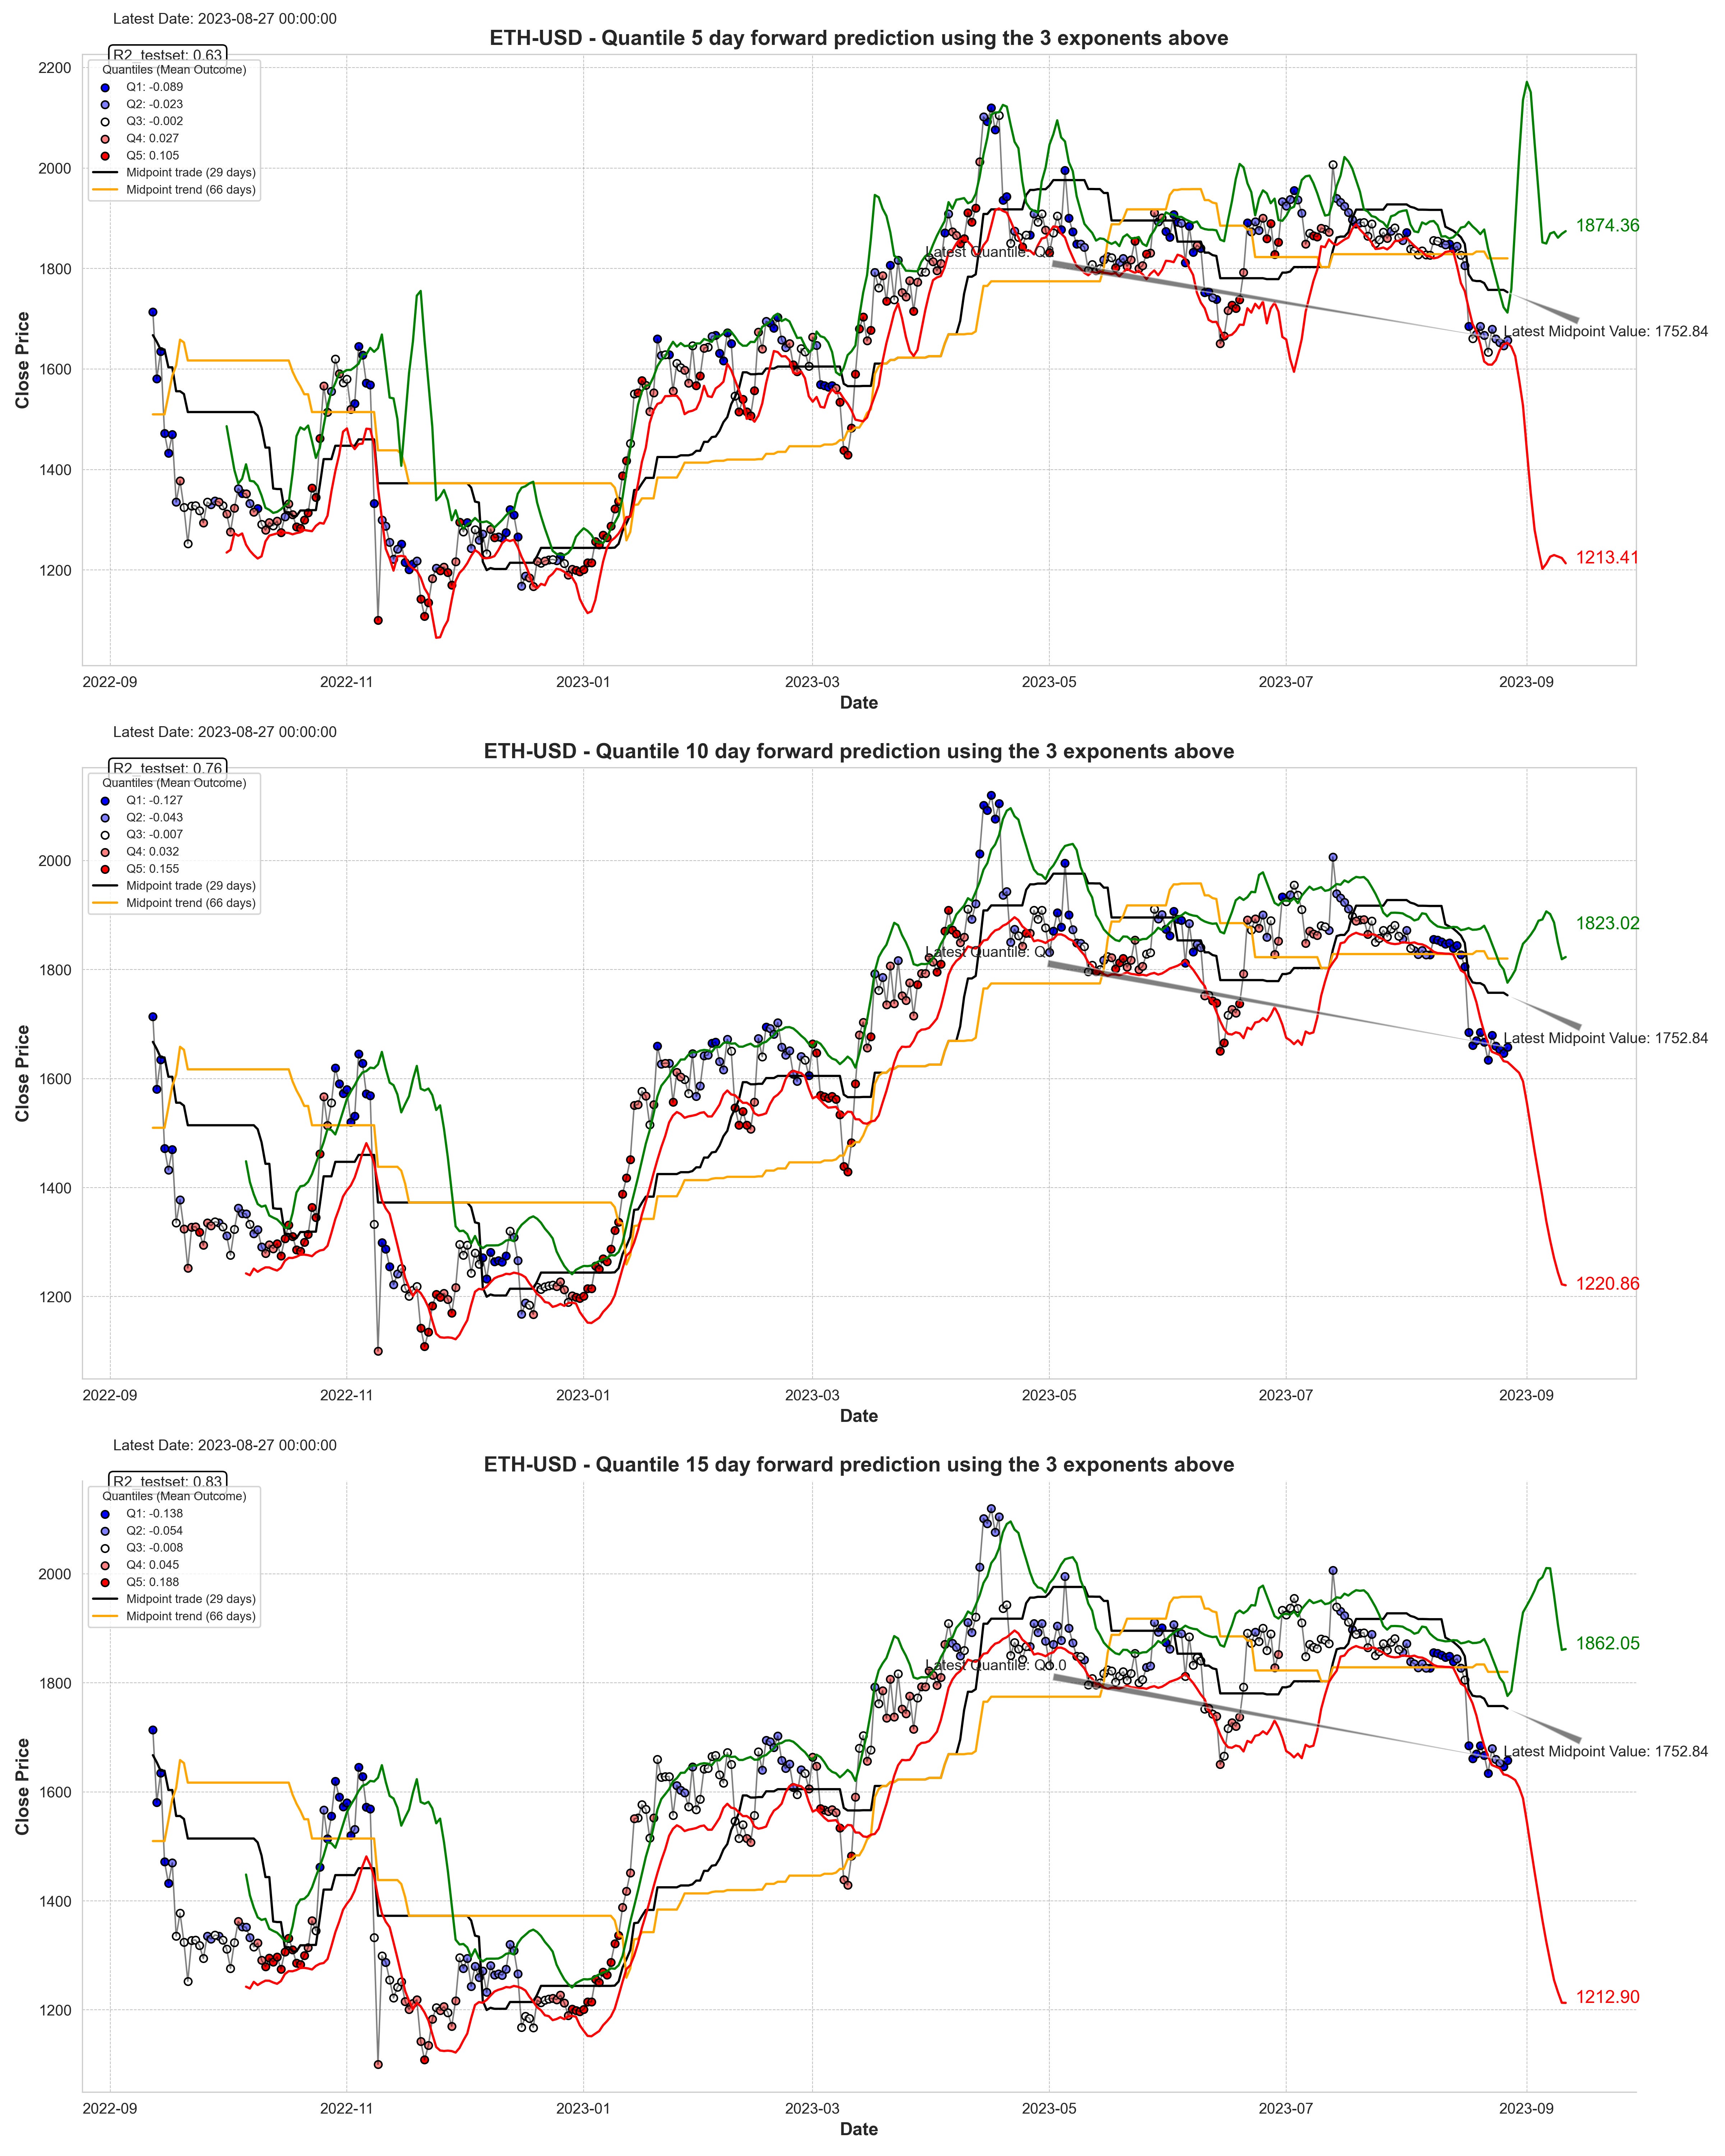
Another addition is the forward return model for two more time frames, the 5-day forward return and the 10-day forward return. In the upper left corner you can see the r-square for the validity of the model.
Index overview
Most indices are still in an uptrend and are therefore - with a few exceptions - in an uptrend. In the USA, the S&P500, Dow Jones, NASDAQ and Russell 2000 are in an uptrend. However, the term return structure determined using the quantiles shows a weak to moderate return structure (slightly negative to neutral 15-day term returns). The Russell 2000 has the lowest signal strength, followed by the NASDAQ and the DJI.
For the VIX, the signal changed to a bullish structure, but with weak term returns, all in quantile 2 or 3.
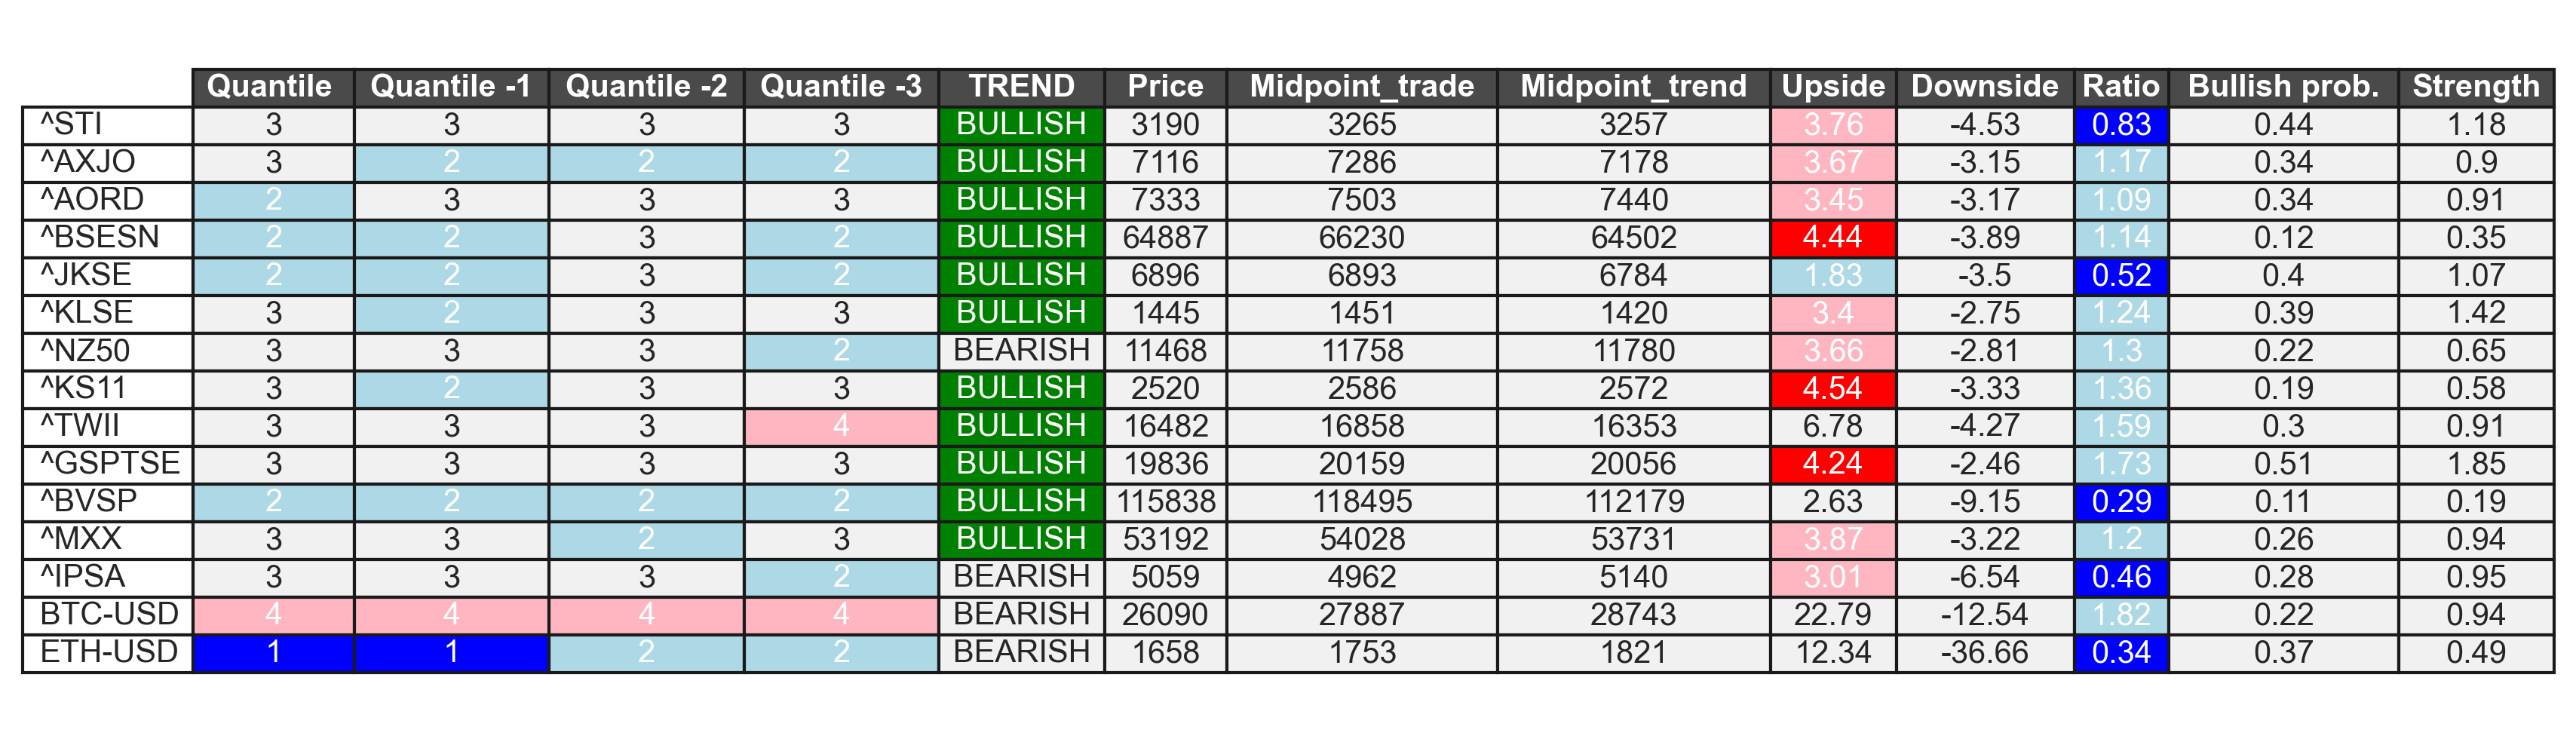
For LONG exposure, the STOXX50 again offers the best signal with multiple quantile 4 prints and the highest signal strength among the various indices. The STOXX50 is still in an uptrend after the recent small correction. The short-term mean is still above the intermediate-term mean, and forward returns are still within a range of quantile 4 to 5.
On the short side, ETH shows the worst performance with two quantile 1 and two quantile 2 prints. The cryptocurrency is in bearish momentum with low signal strength and more potential downside than upside.
LONG:
New: 3 different time frames for the forward return model

SHORTS:
Last weeks return (5 days:)
Long:
STOXX50 +1,18%
Short:
BSVP +2,01%
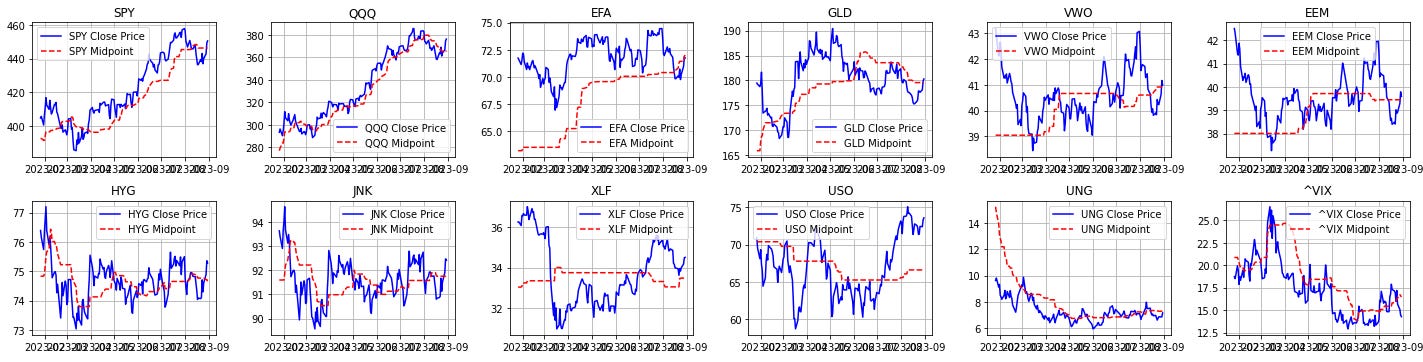
ETF implied macro forecasts
This is a new model designed to simply focus on the price movement of the various ETFs compared to the macro signal model. As I have stated several times in recent weekly roundups, focusing solely on price movement and momentum is what makes us money. So why don't we also use the information stored in various ETFs that are mainly judged by momentum (bullish/bearish) and extract the given information for GDP, leading indicators or capacity utilization. The next images show the results of the model. The full set is behind the paywall.
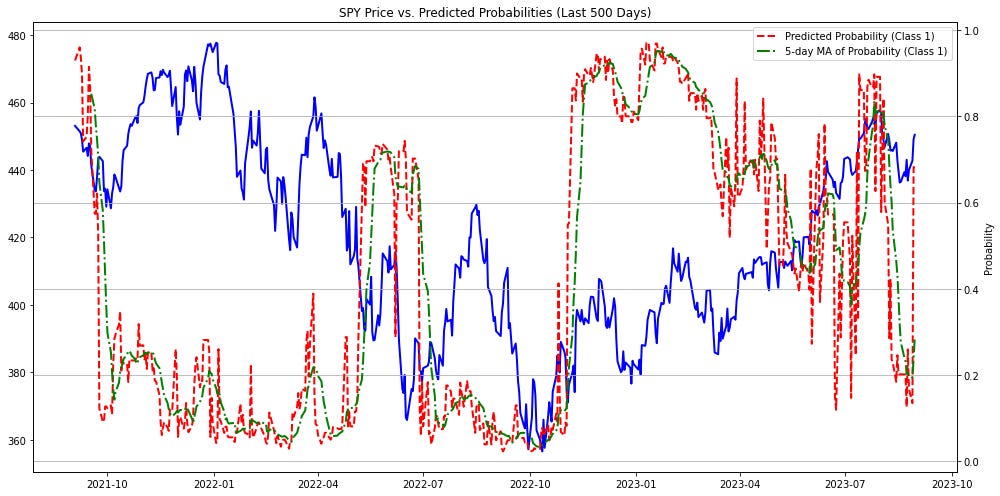
GDP implied by ETF price action
The above inputs now form the core structure to explain the current GDP dynamics (3-month difference in GDP growth). In general, we want to see rising GDP momentum in conjunction with rising stock price momentum. By backtesting it becomes clear, that rising GDP momentum is associated with an increased likelihood of positive returns.
This is not the only factor to be evaluated, but as a general basis it is an important component. At this point, the information implied by the exchange-traded funds becomes more volatile, as we see some positive crossovers of the mean values within the model. As a result, the projected probability of rising GDP momentum rises back above 60%. Looking at the 5-day moving average, we see a less volatile picture of probabilities, still below 50%, suggesting a declining GDP momentum. If the price trend continues, it is very likely that both probability measures will rise above the 50% mark again, which would imply positive GDP momentum for the ETFs.
Yearly coupon:
monthly coupon:
Keep reading with a 7-day free trial
Subscribe to This Time is Different to keep reading this post and get 7 days of free access to the full post archives.